All Wikipedia Plots
Since January I have created a tool which allows for the creation of a database of Wikipedia edits, Namespace Database. As I now have this database I have been able to create the following plots. This is a work in progress, and will evolve over time :)
💡 Tip: Click and hold the images to zoom
Glossary
Namespace
A namespace on Wikipedia is the section that the page is in. Most people only know about the article or main namespace, where the articles are. There are other namespaces such as User for profiles, Wikipedia for policy discussion etc.
Talk space
The main focus of the last third of the graphs is talk space. This is section for discussion of page, and every namespace has a corresponding talk space. In my graphs I am only looking at the talk space of articles. For example, people arguing whether to use BC or AD on the Jesus article
Special Users
Simply these are users you could think of as admins. They have privilege to edit protected pages, confirm edits aren’t spam etc. You can view all of the groups in figures 18.1 and 18.2.
Bot editors
Bots on Wikipedia don’t directly add content, but they help by doing the tedious tasks like fixing broken links and adding templates, which help humans fix articles.
Pages
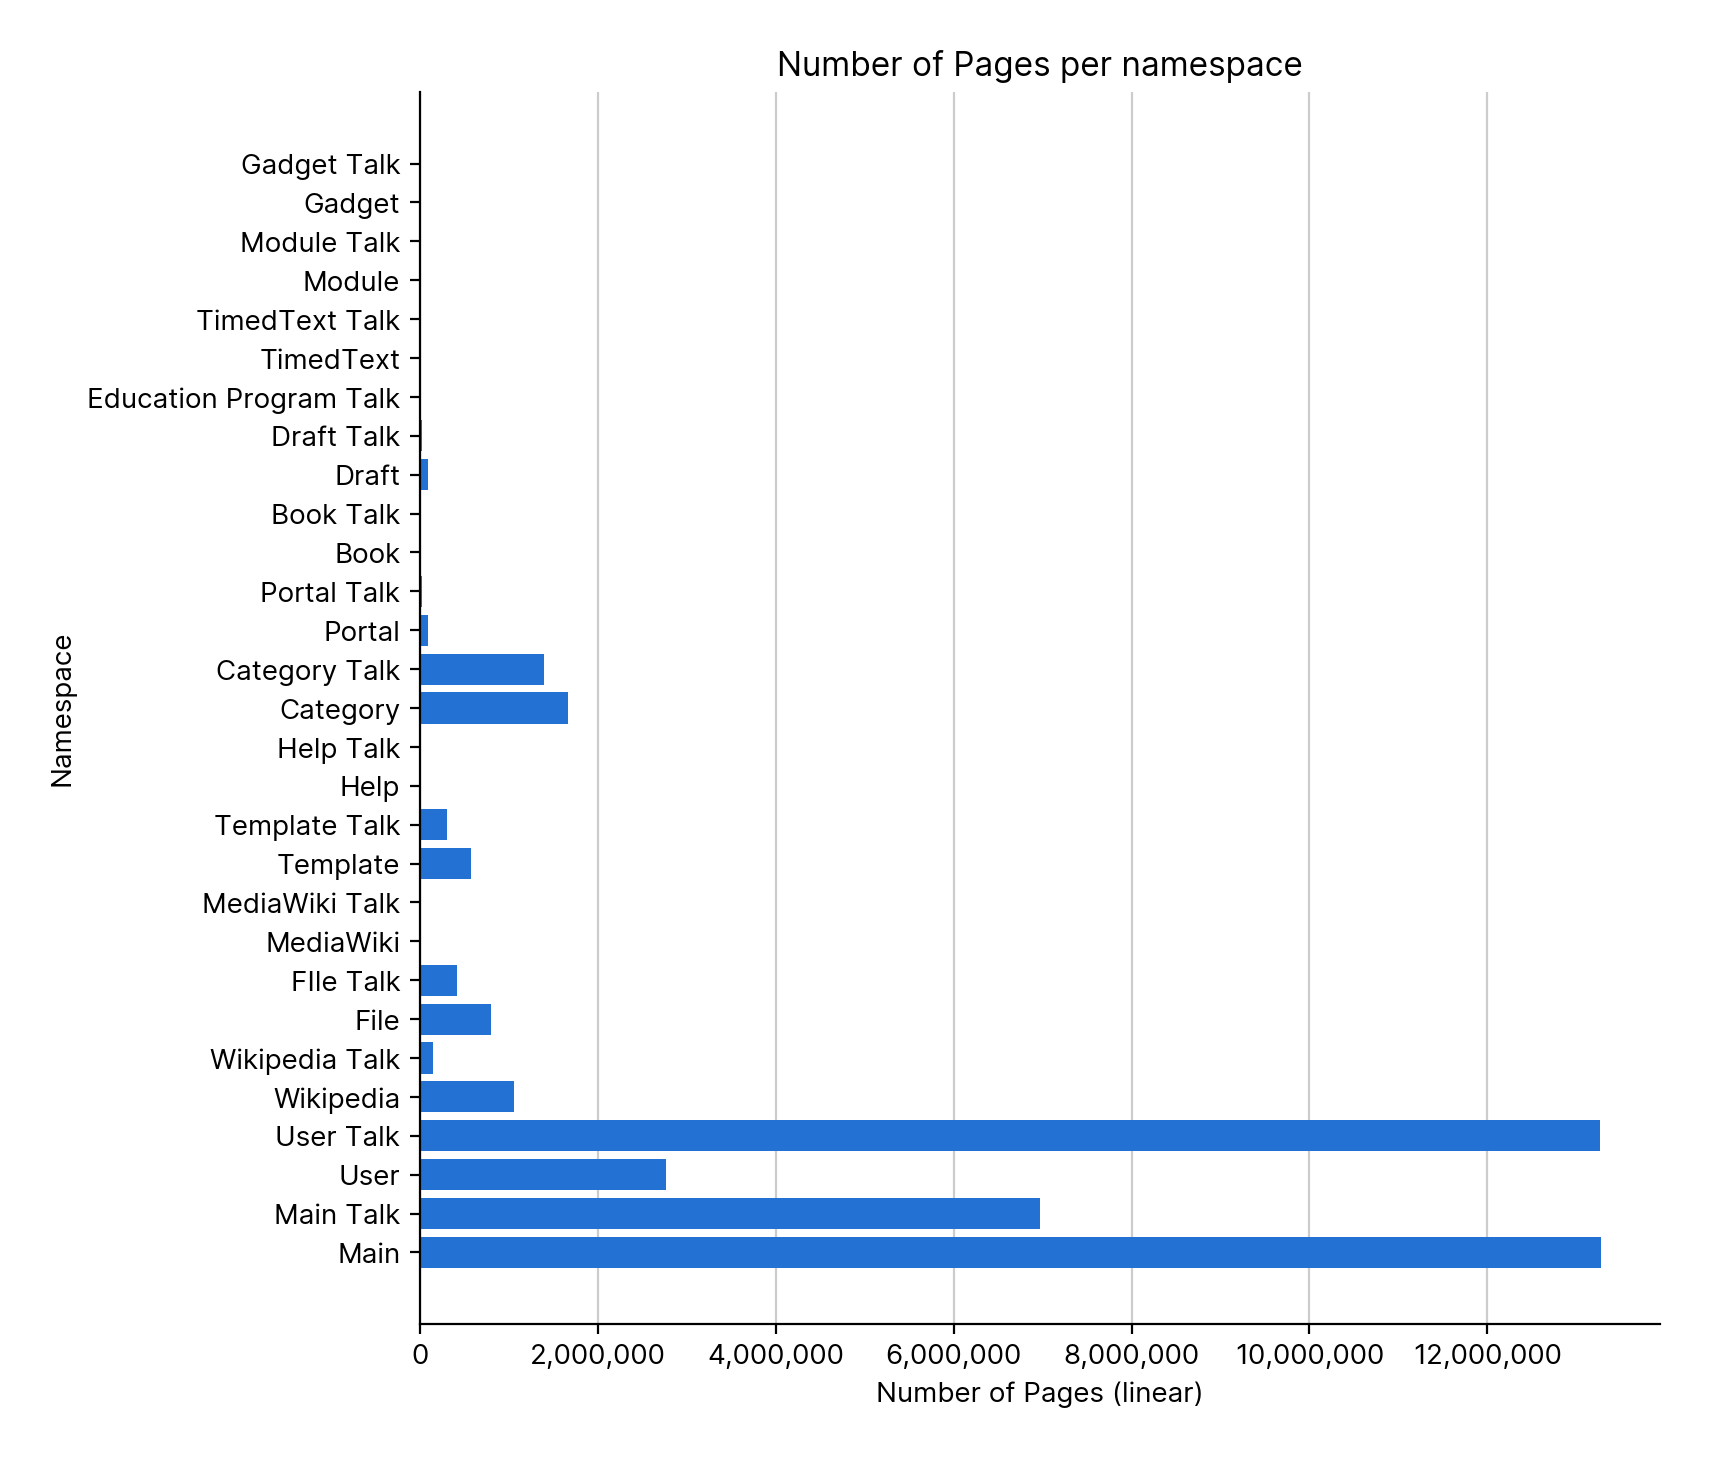
Figure 3.1 linear
The namespaces with the most pages are Article and User talk. User talk has more pages than User as users themselves usually create their own pages, whereas anyone can write on your talk page.
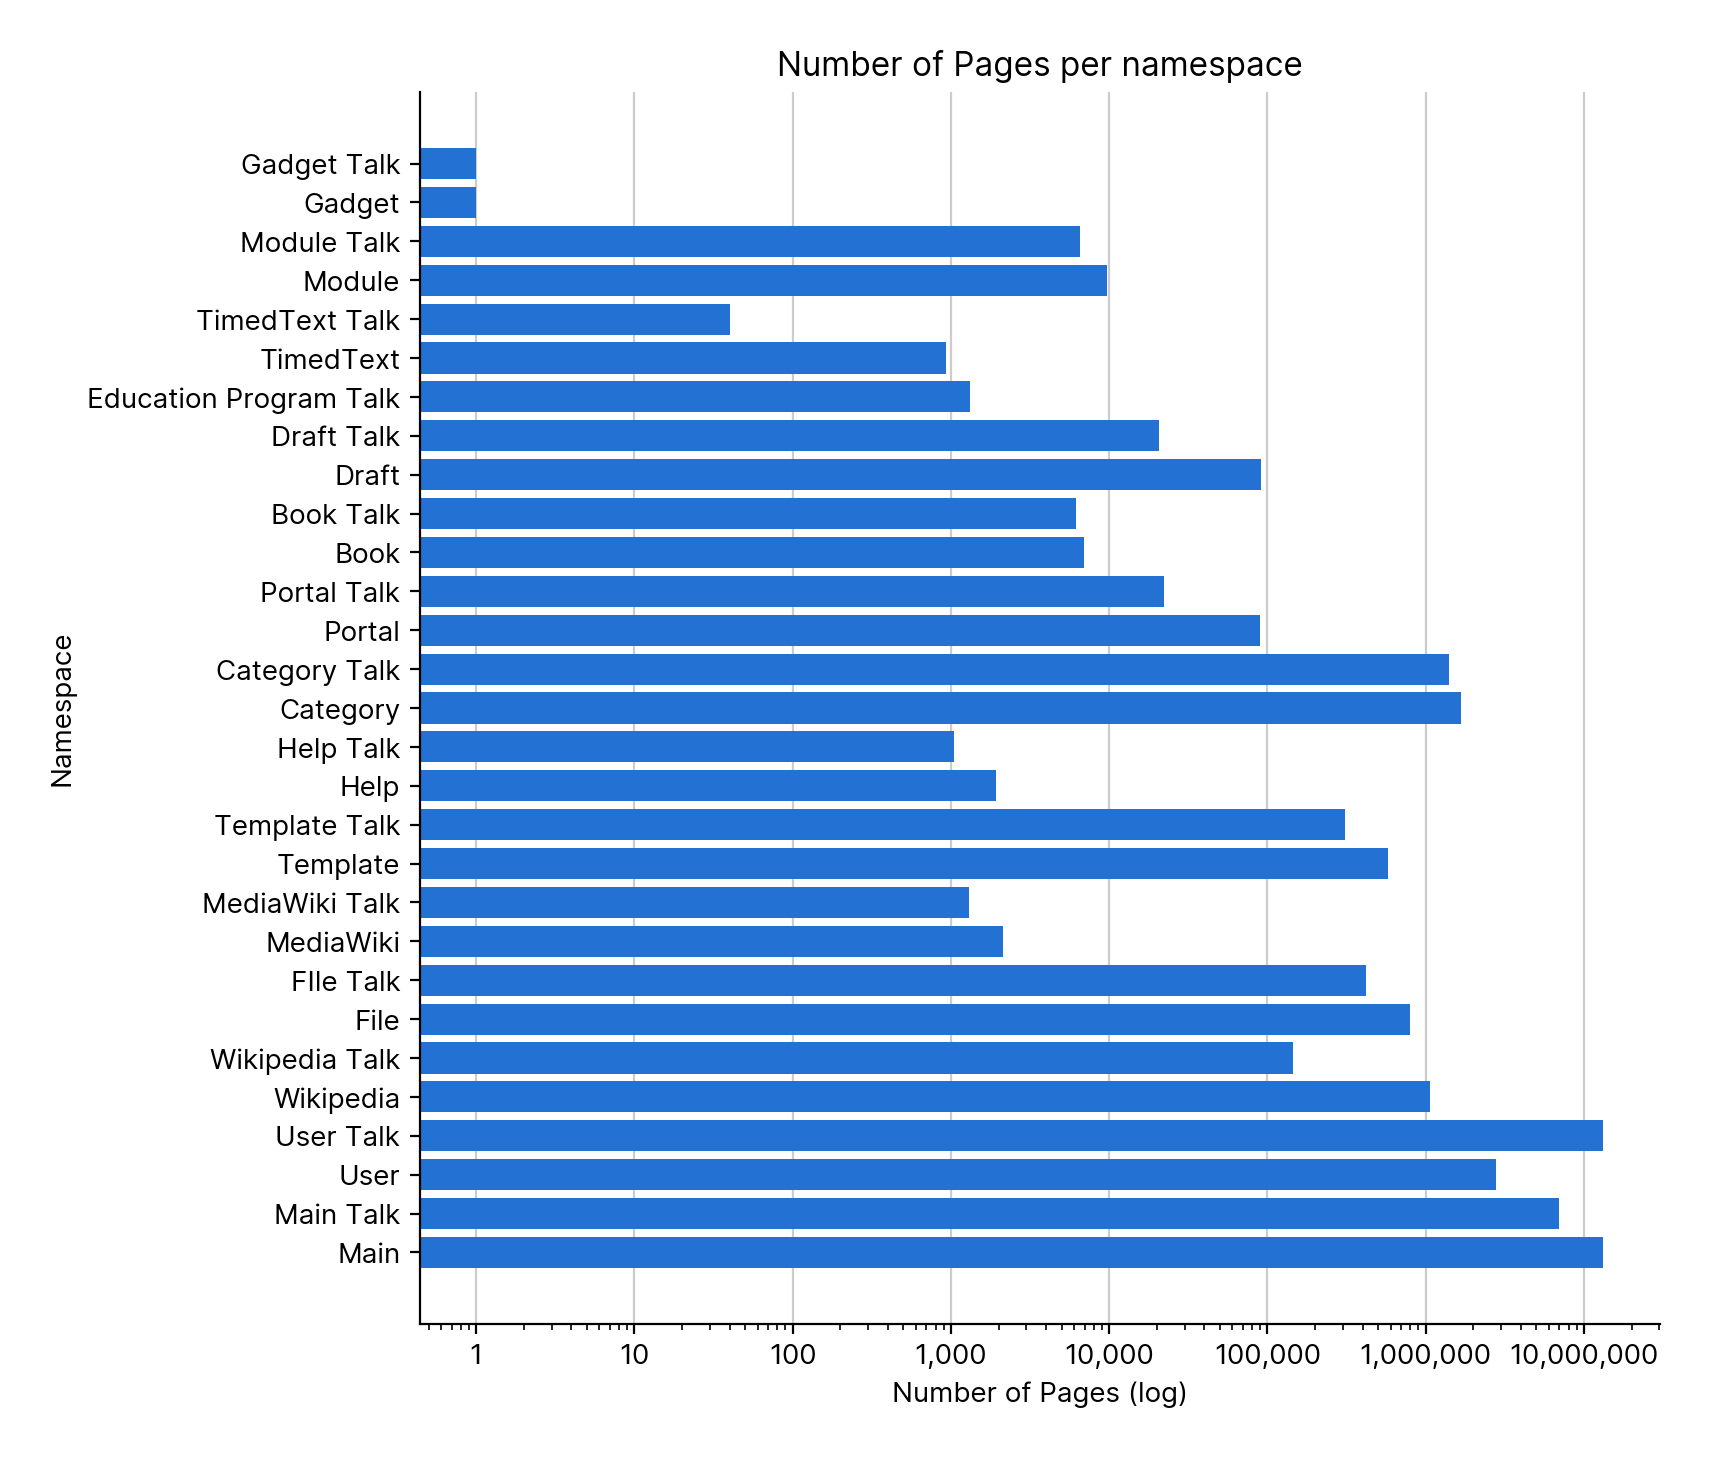
Figure 3.2 log
With a log view on the same plot, we see that there is a large variety in the number of pages in each namespace. Two namespaces have no pages and are not listed here which are the virtual namespaces -1 Special and -2 Media.
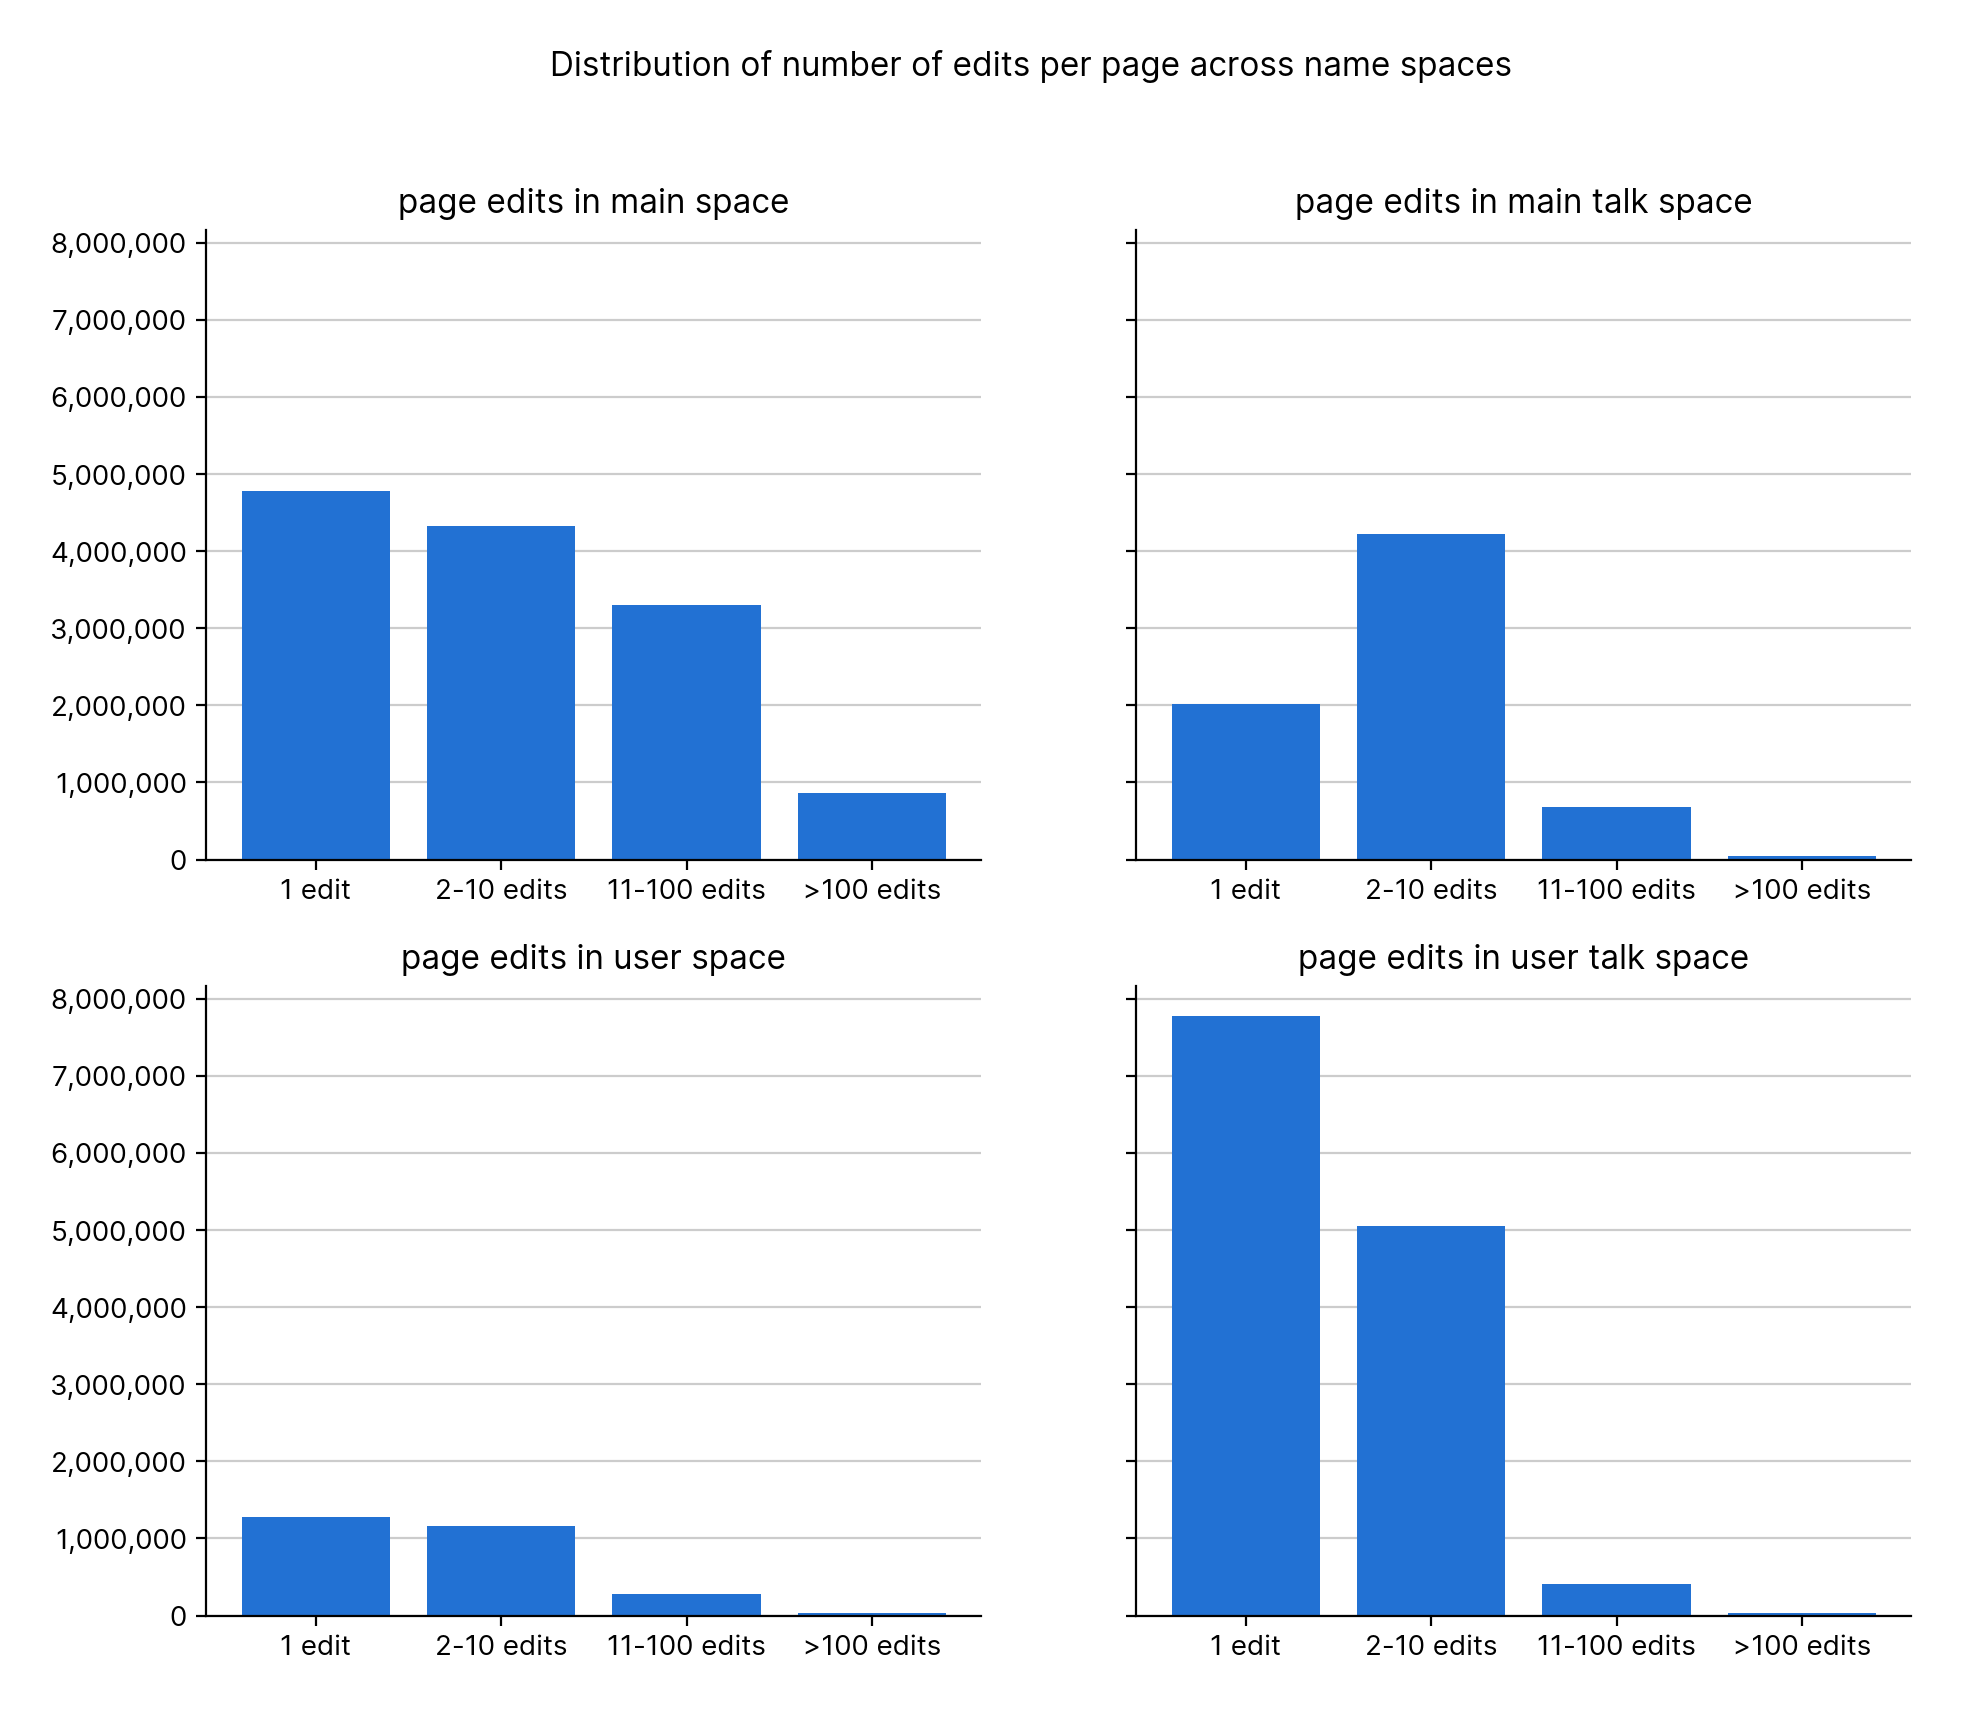
Figure 11
Most of the pages in the top four namespaces only have a single edit. Main talk space however more often has a couple edits than a single one, potentially due to a talk edit provoking conversation. Unsurprisingly, main space has the highest ratio of pages with over 100 edits. It’s worth noting that the Y-axes are consistent across all plots.
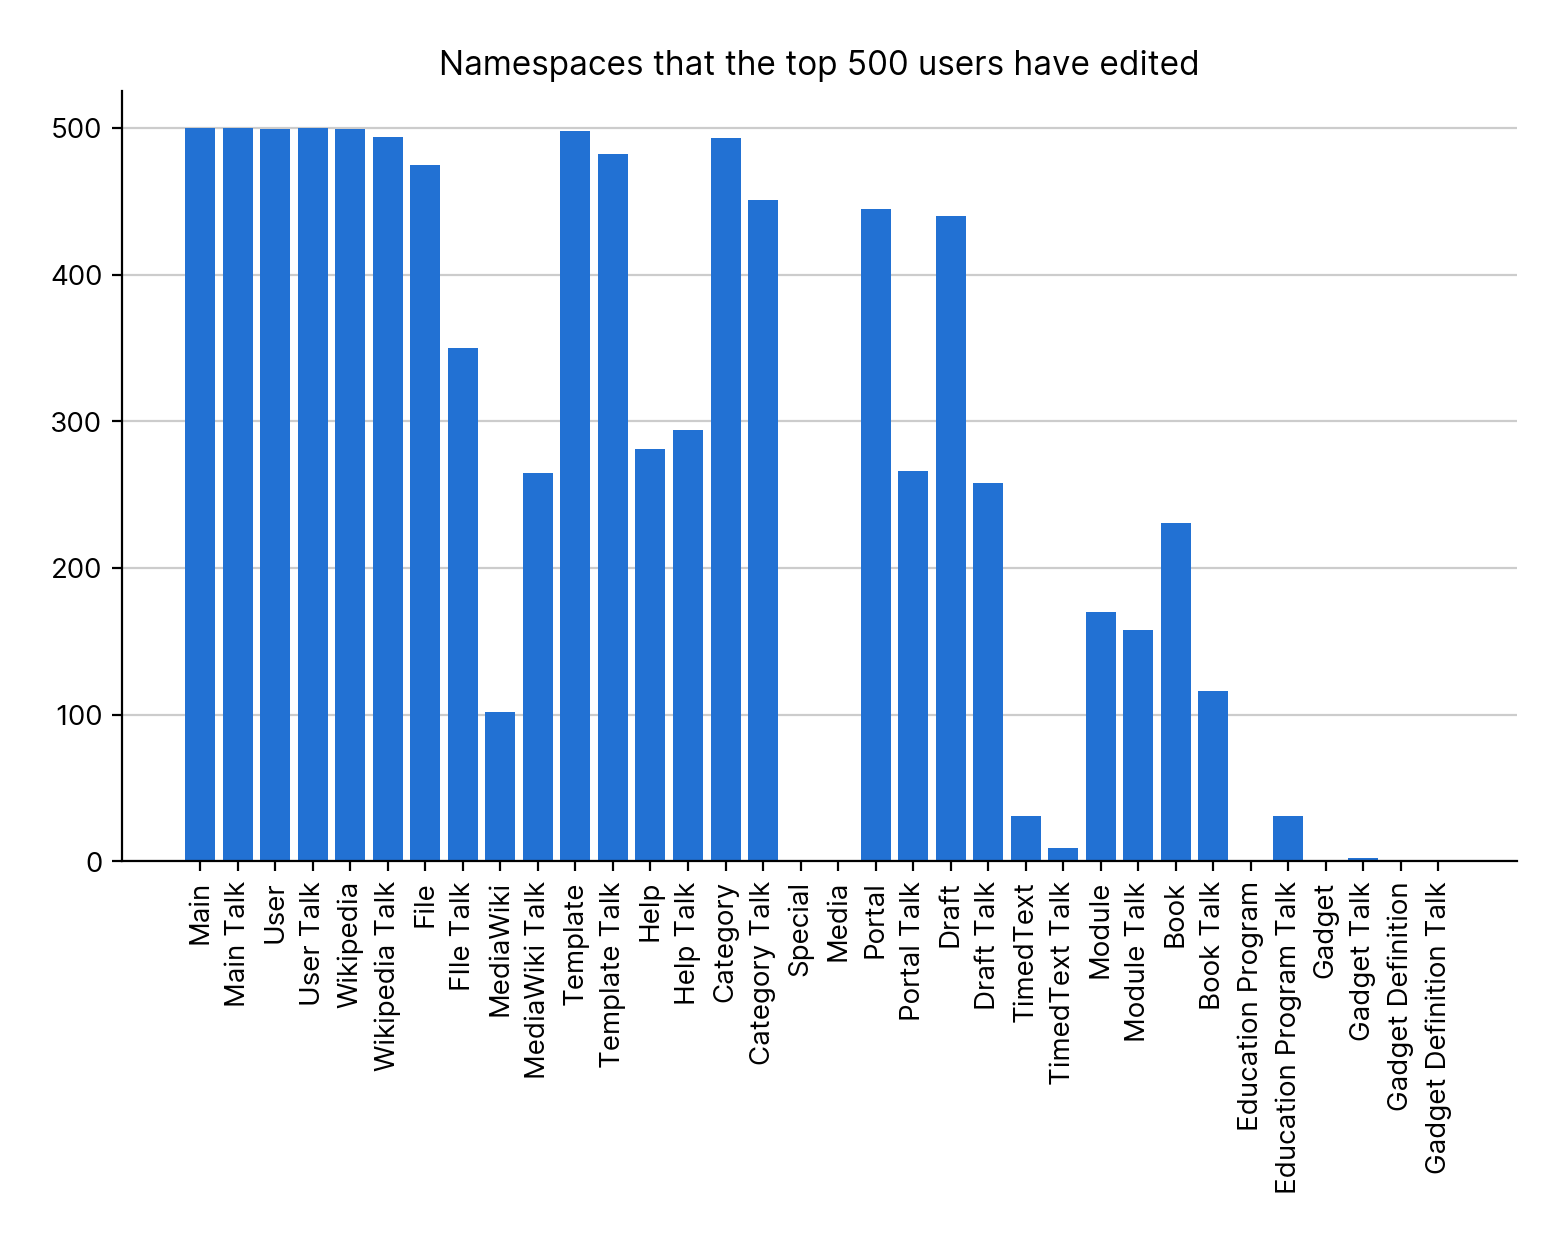
Figure 16
This plot is a alpha version of the next plot. We see that the most prolific editors have edited in pretty much all namespaces except Mediawiki, where you need to be a sysadmin to edit; TimedText and TimedText Talk, which is for audio and video files; Education Program and Education Program talk, which were superseded by WikiEdu;, Gadget and Gadget talk, for JavaScript tools for Wikipedia; Gadget definition and Gadget definition talk, for the JavaScript itself
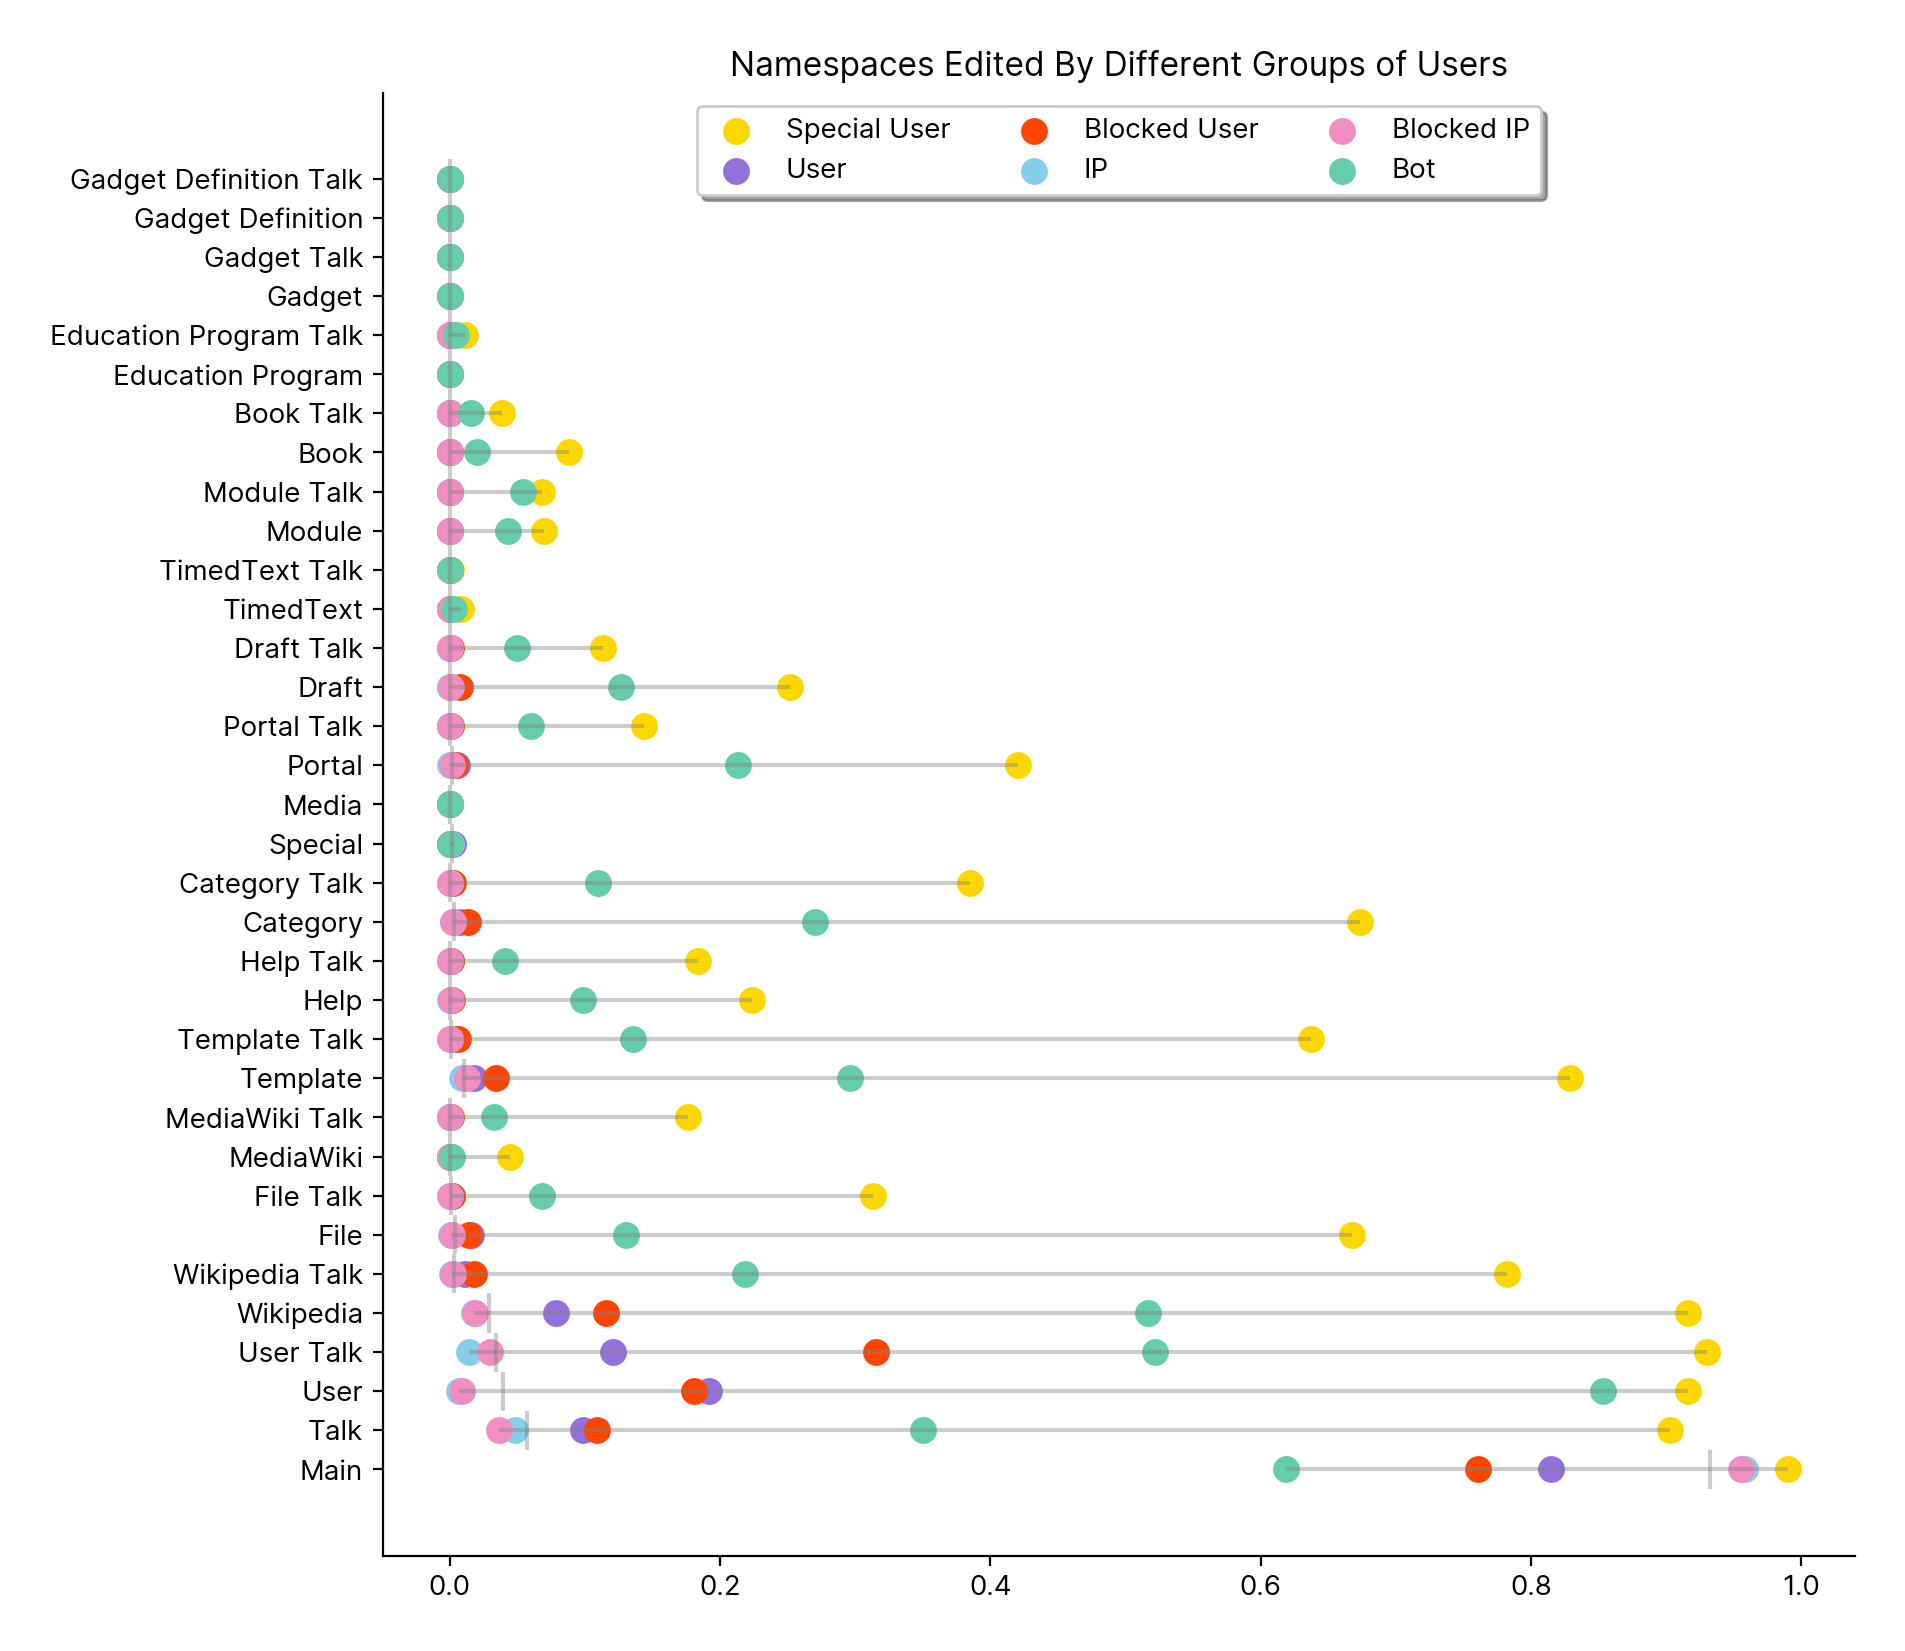
Figure 29
Unsurprisingly, the namespace with the most editors is main article space, with all other namespaces having less engagement. Bots are active in a lot of namespaces, and ~40% don’t edit main space.
Users
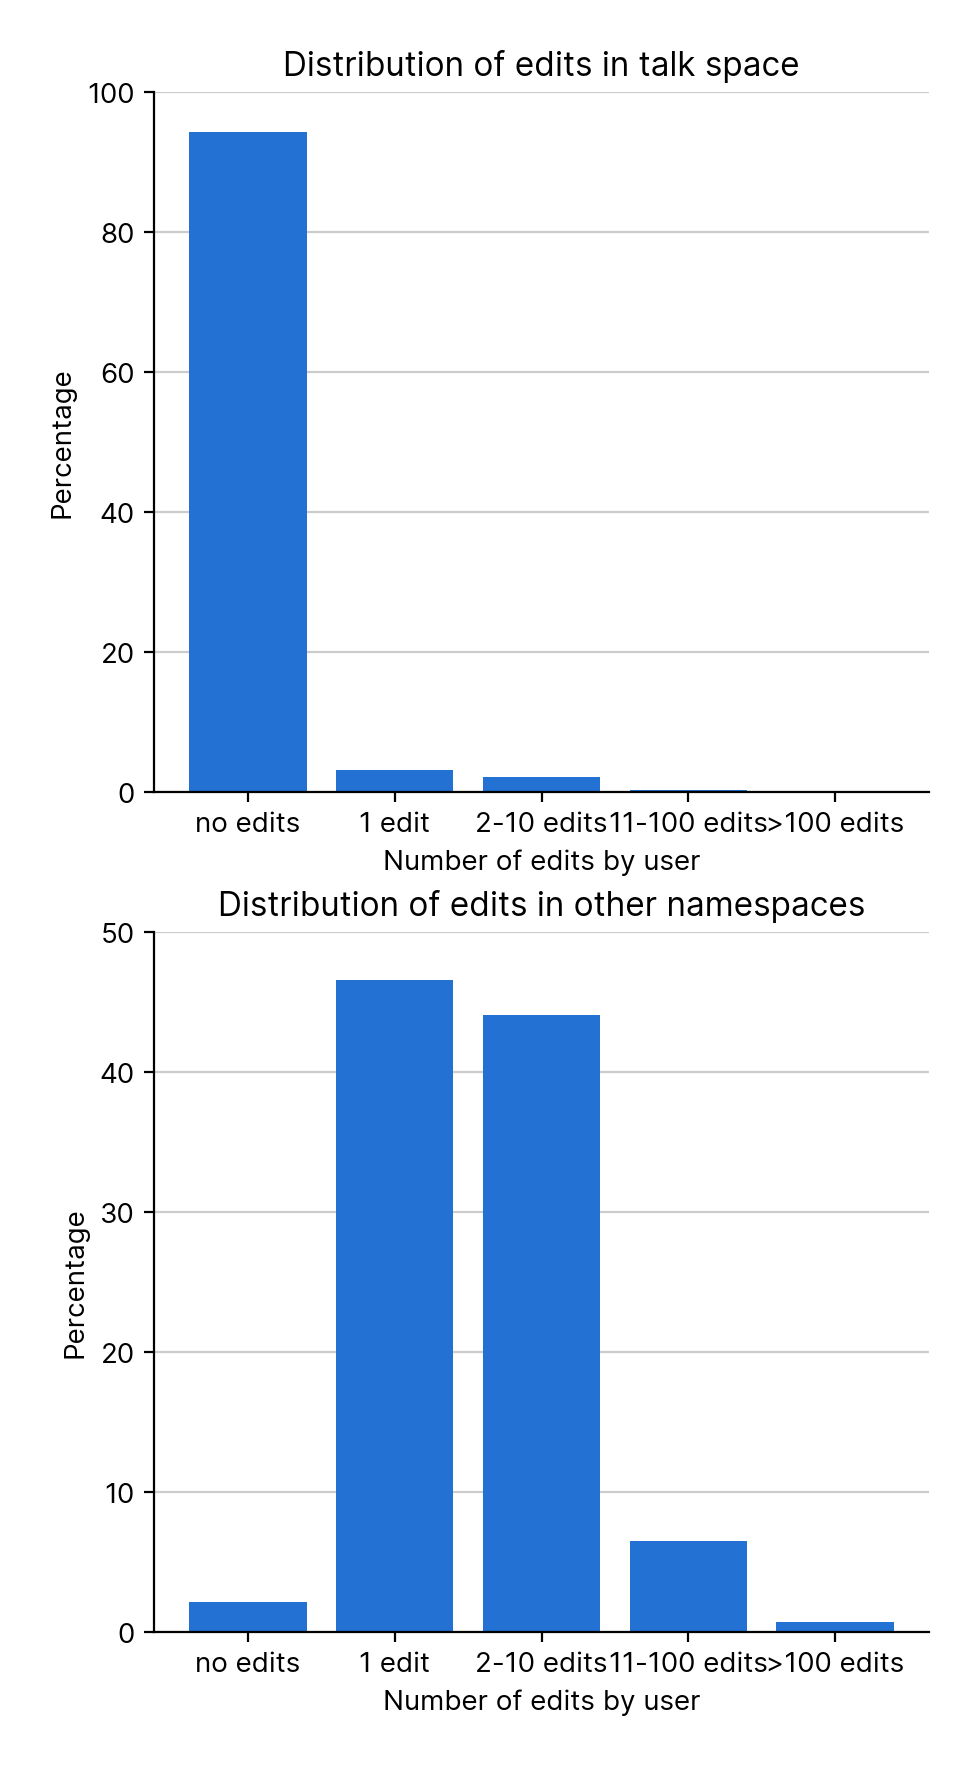
Figure 1
94.3% of users do not edit in talk space. In other namespaces, across all users, most only make a single edit.
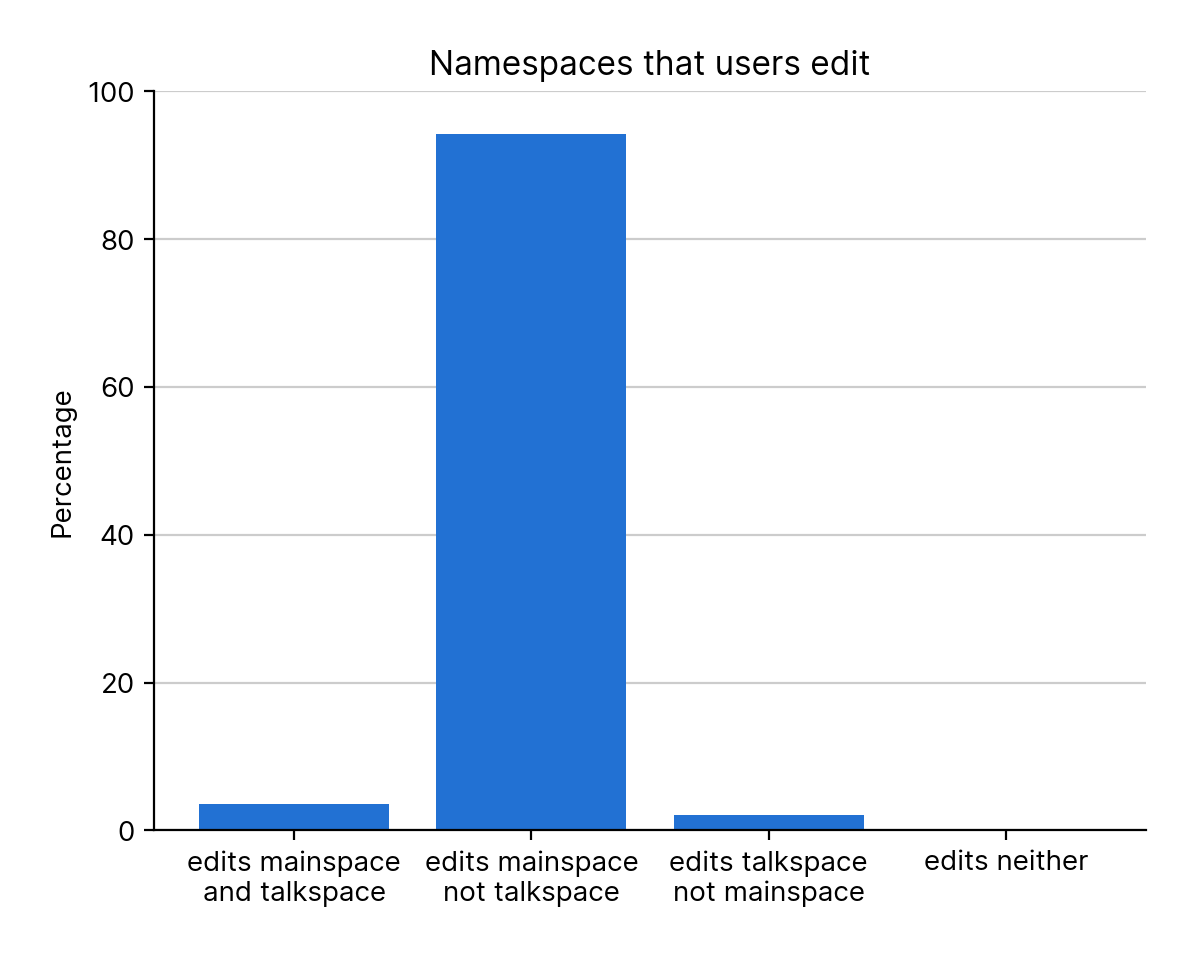
Figure 4
Showing the intersection of the above graphs, 3.6% of users edit both main and talk space.
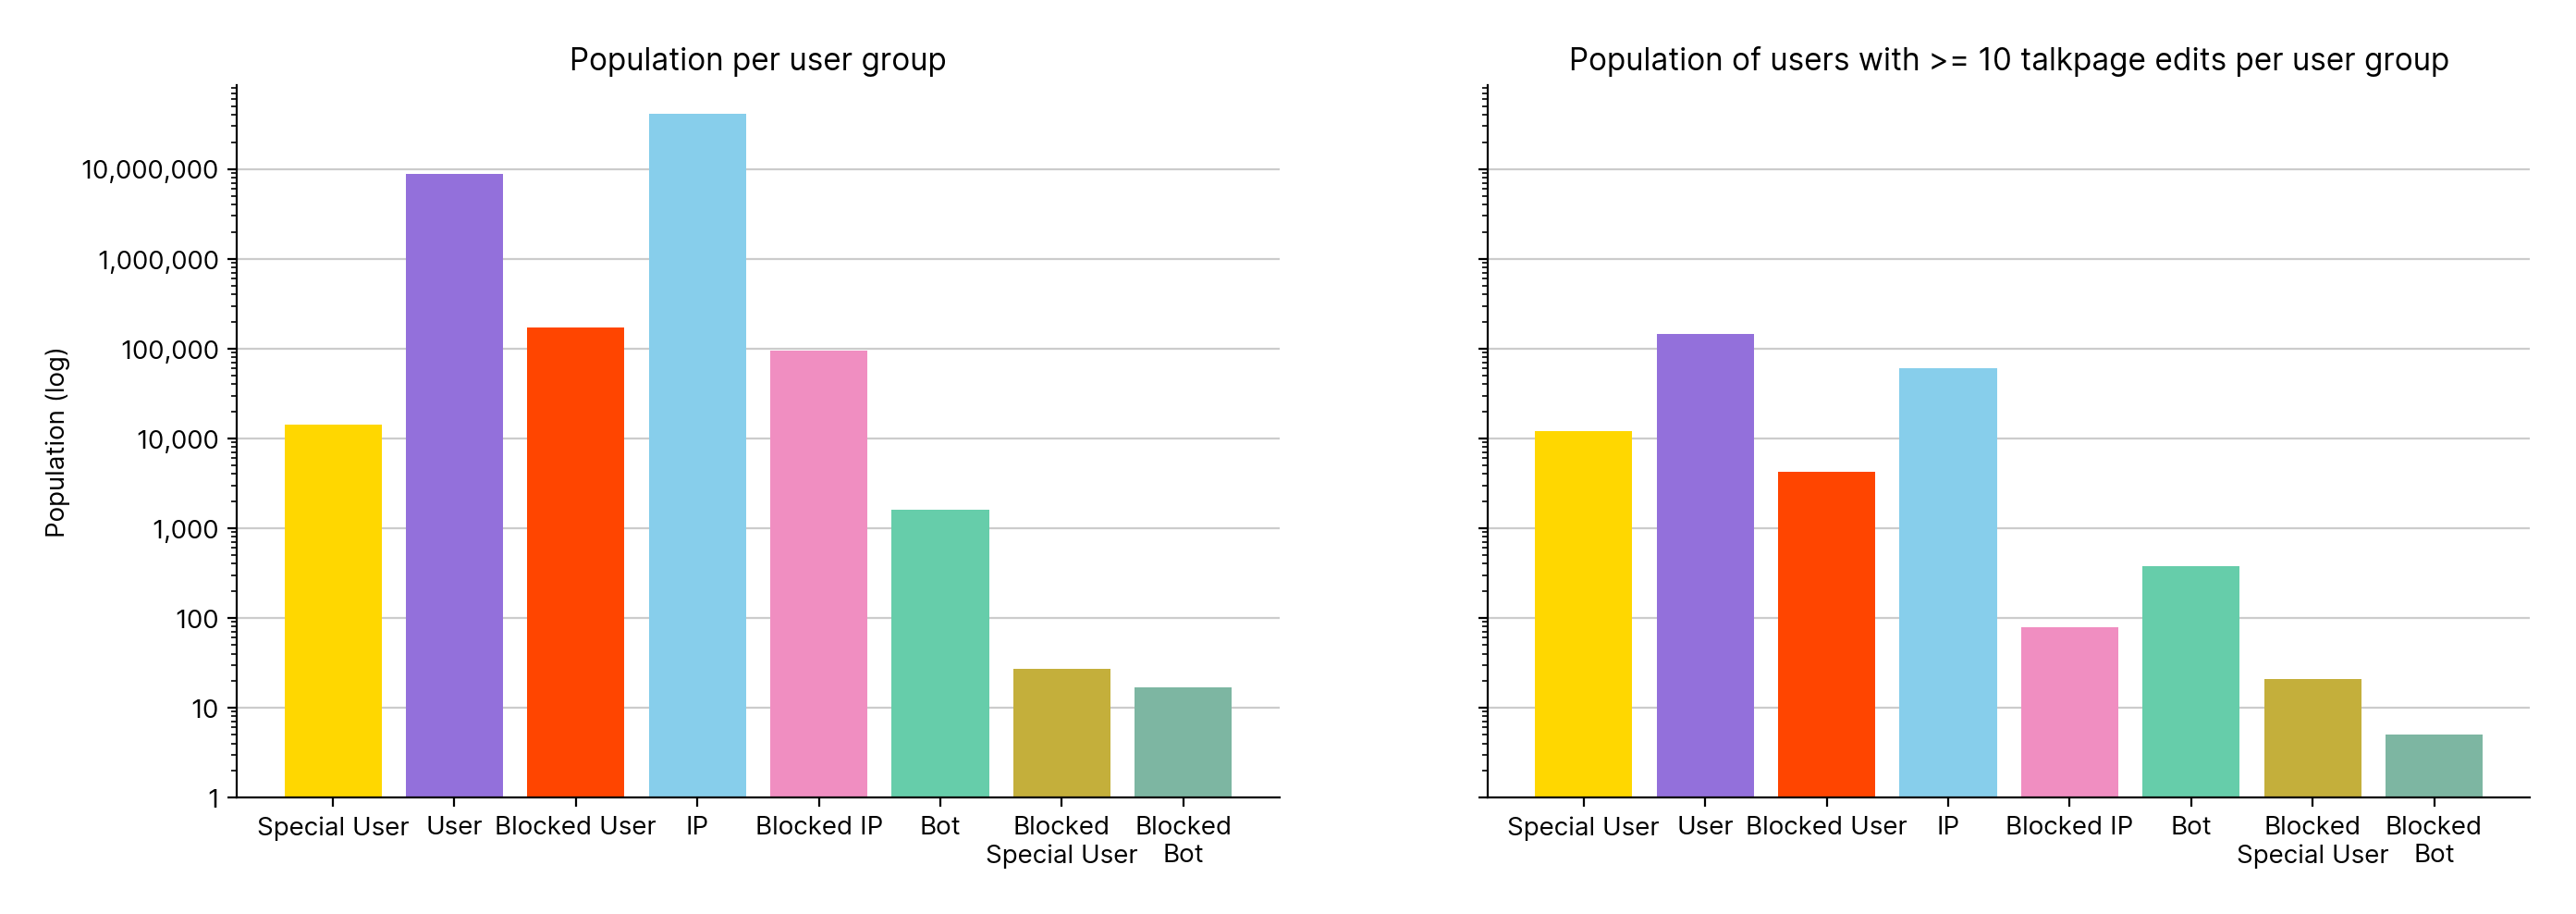
Figure 2
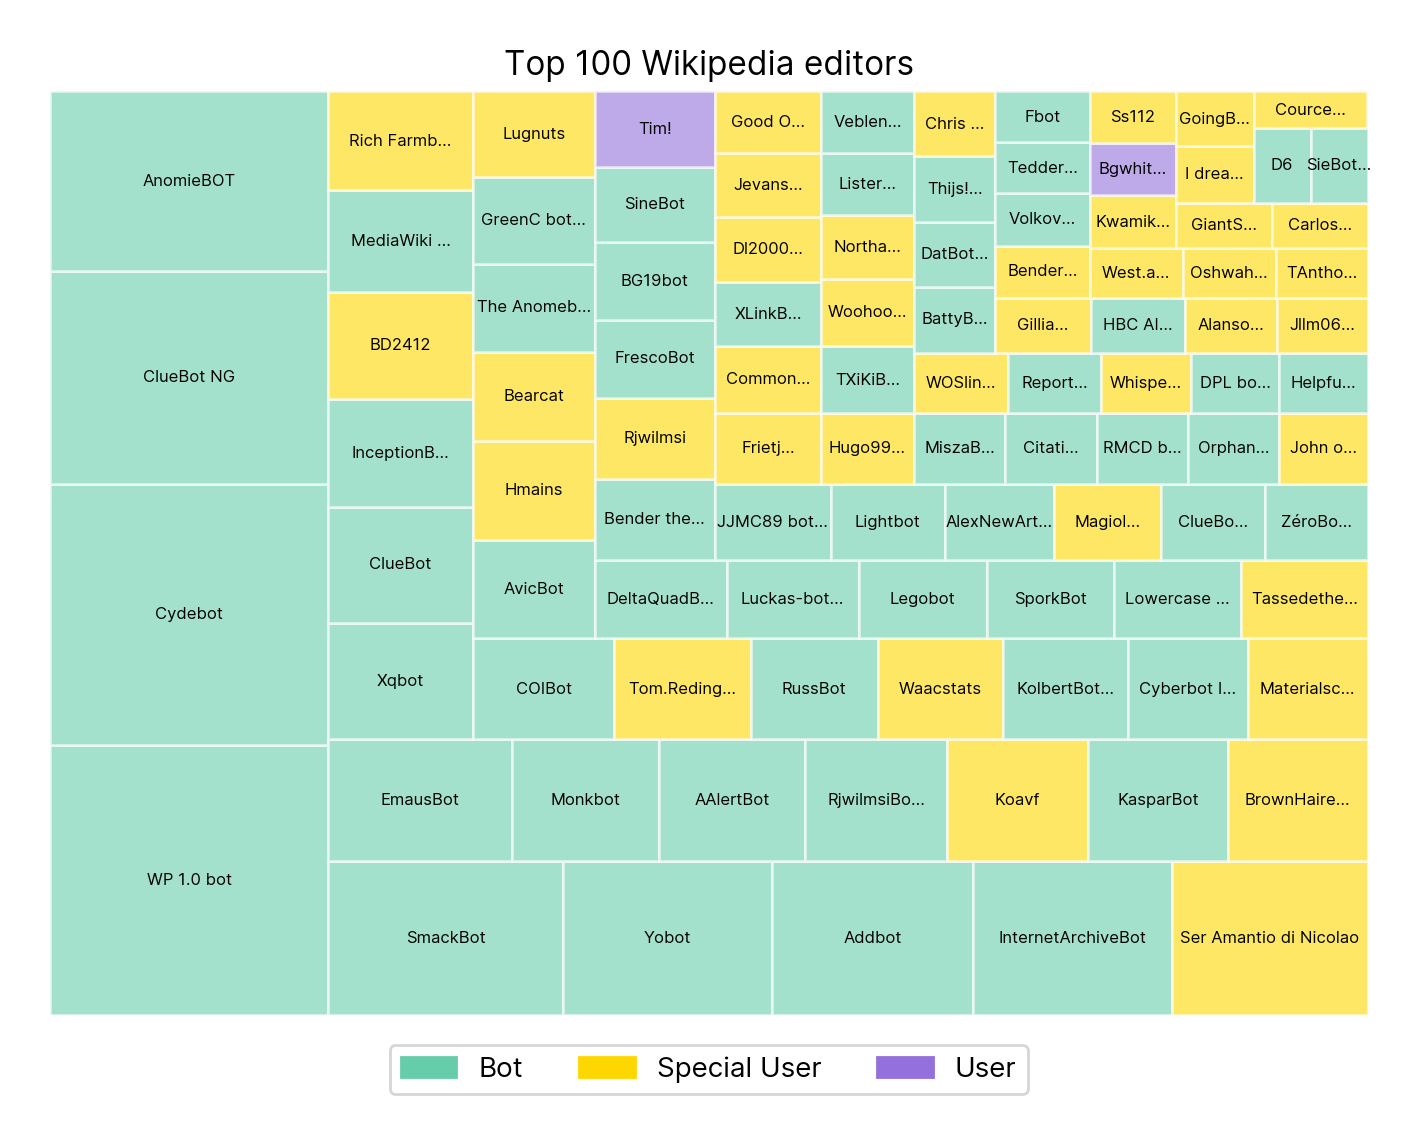
Figure 40.1
Figure 40.2
Figure 40.3
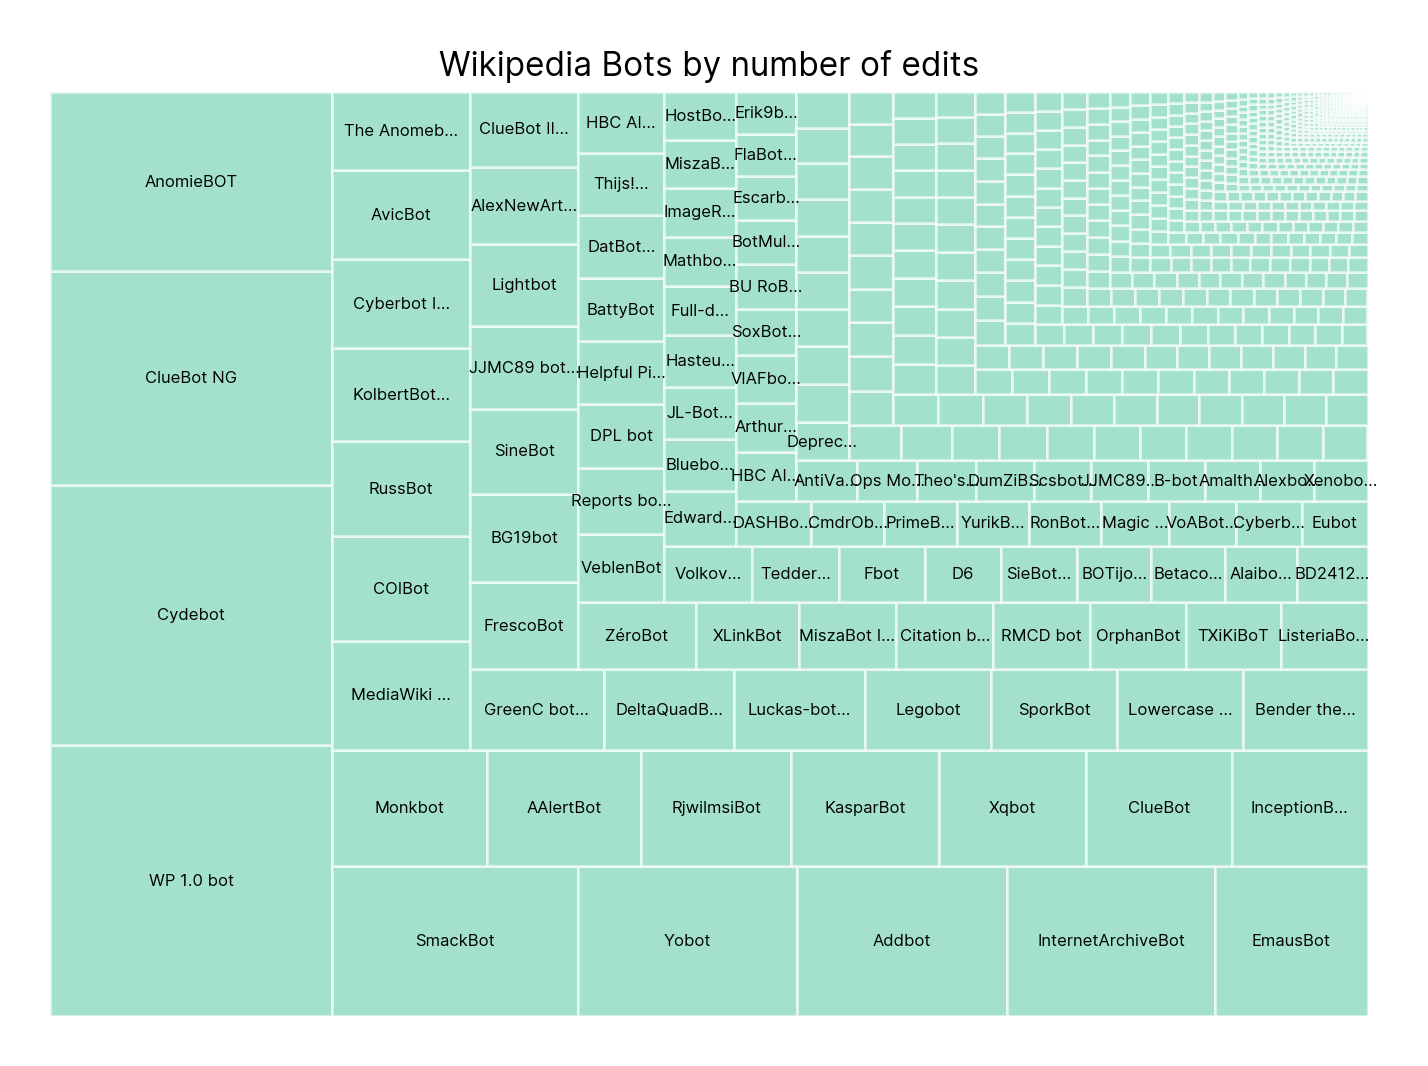
Figure 40.4
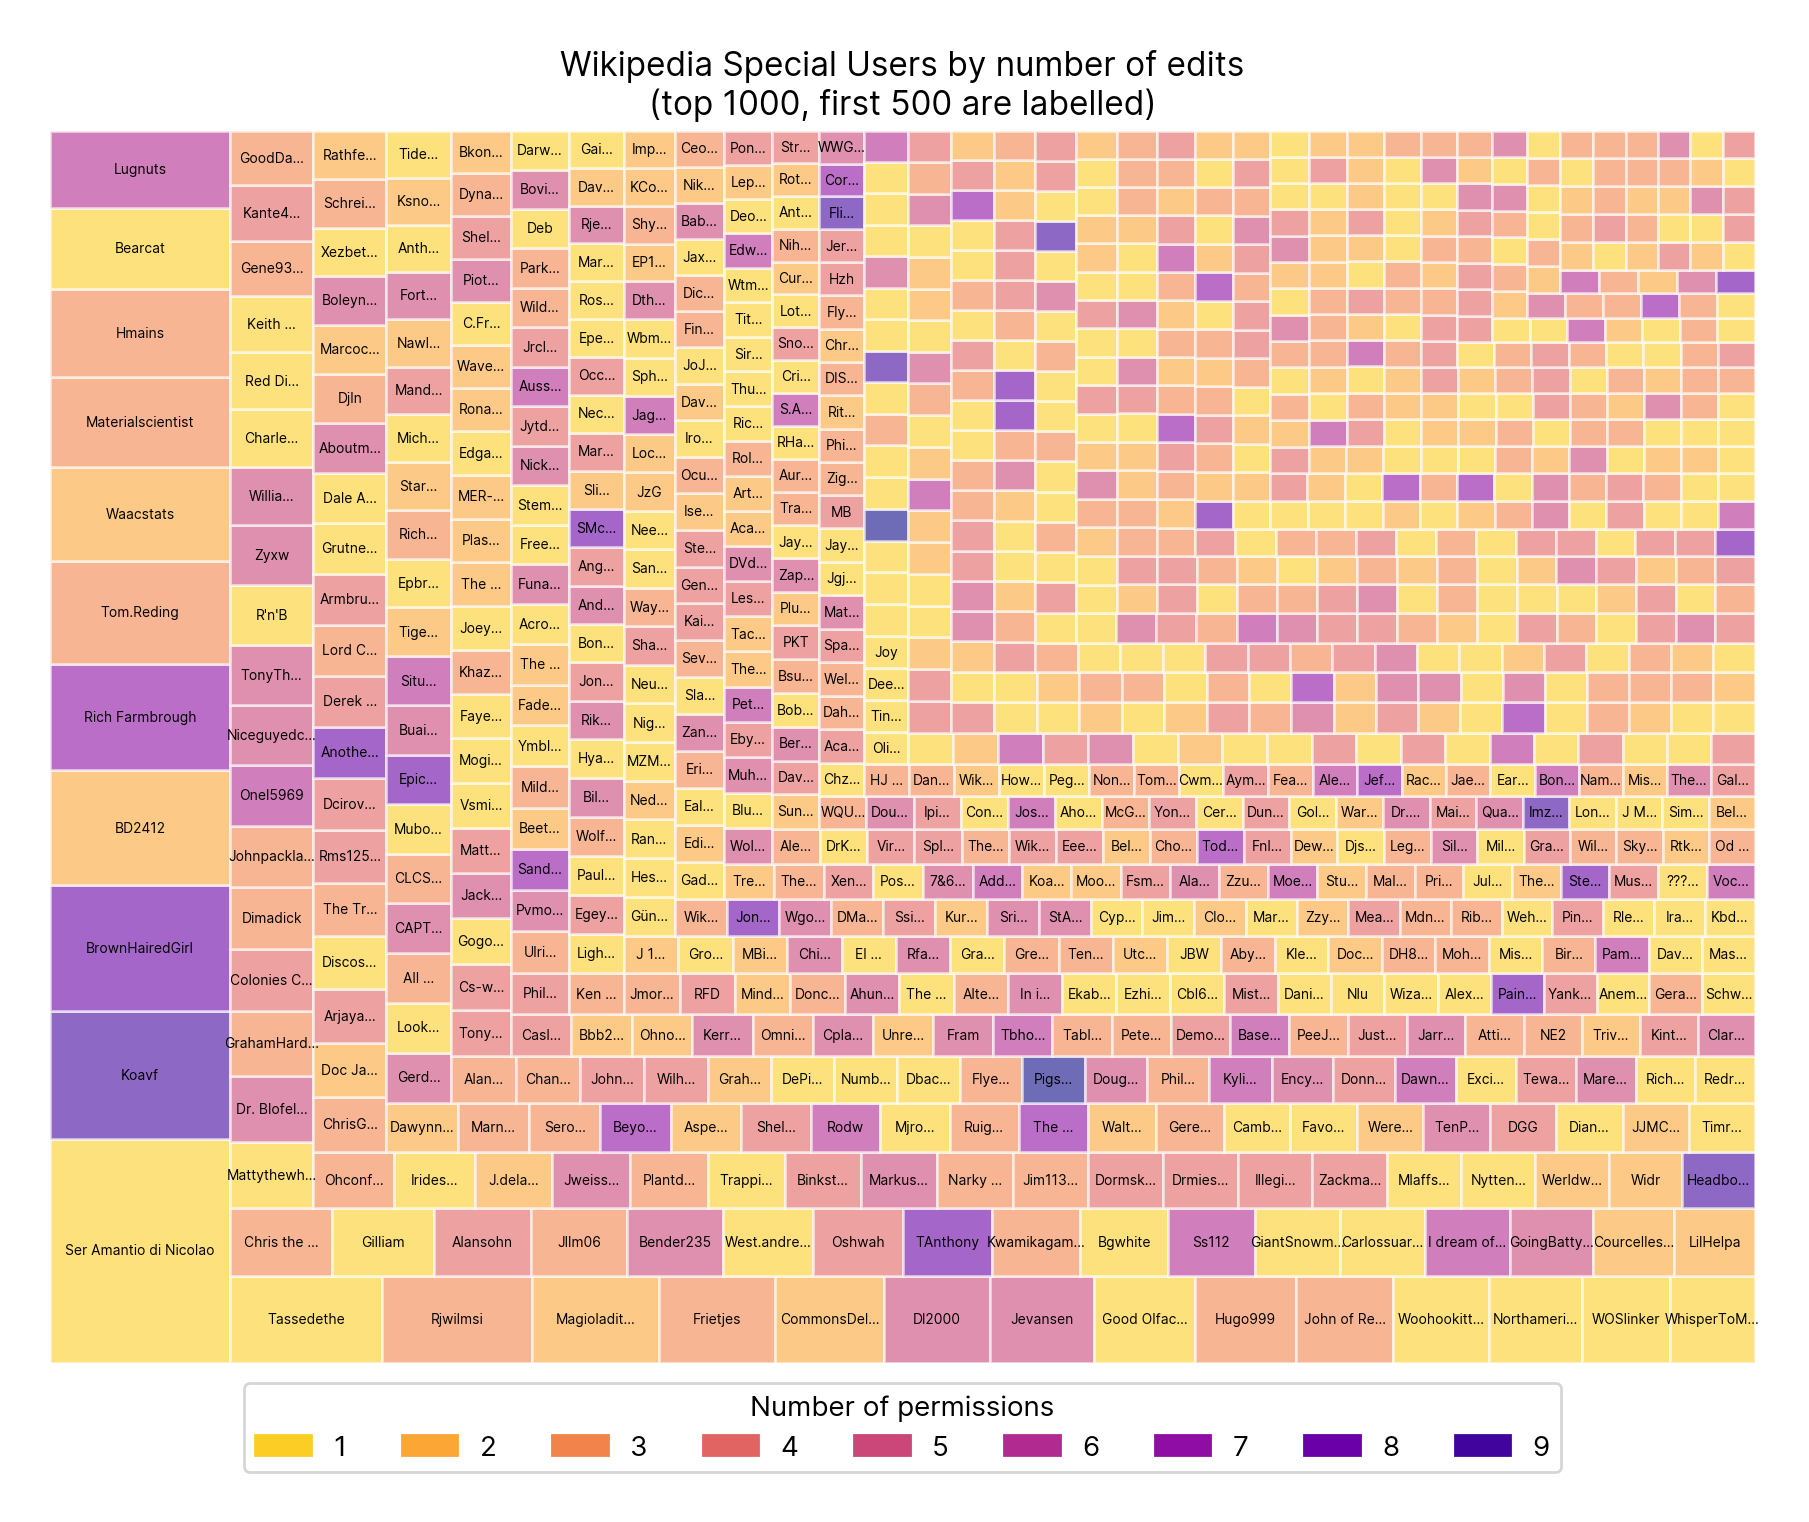
Figure 40.5
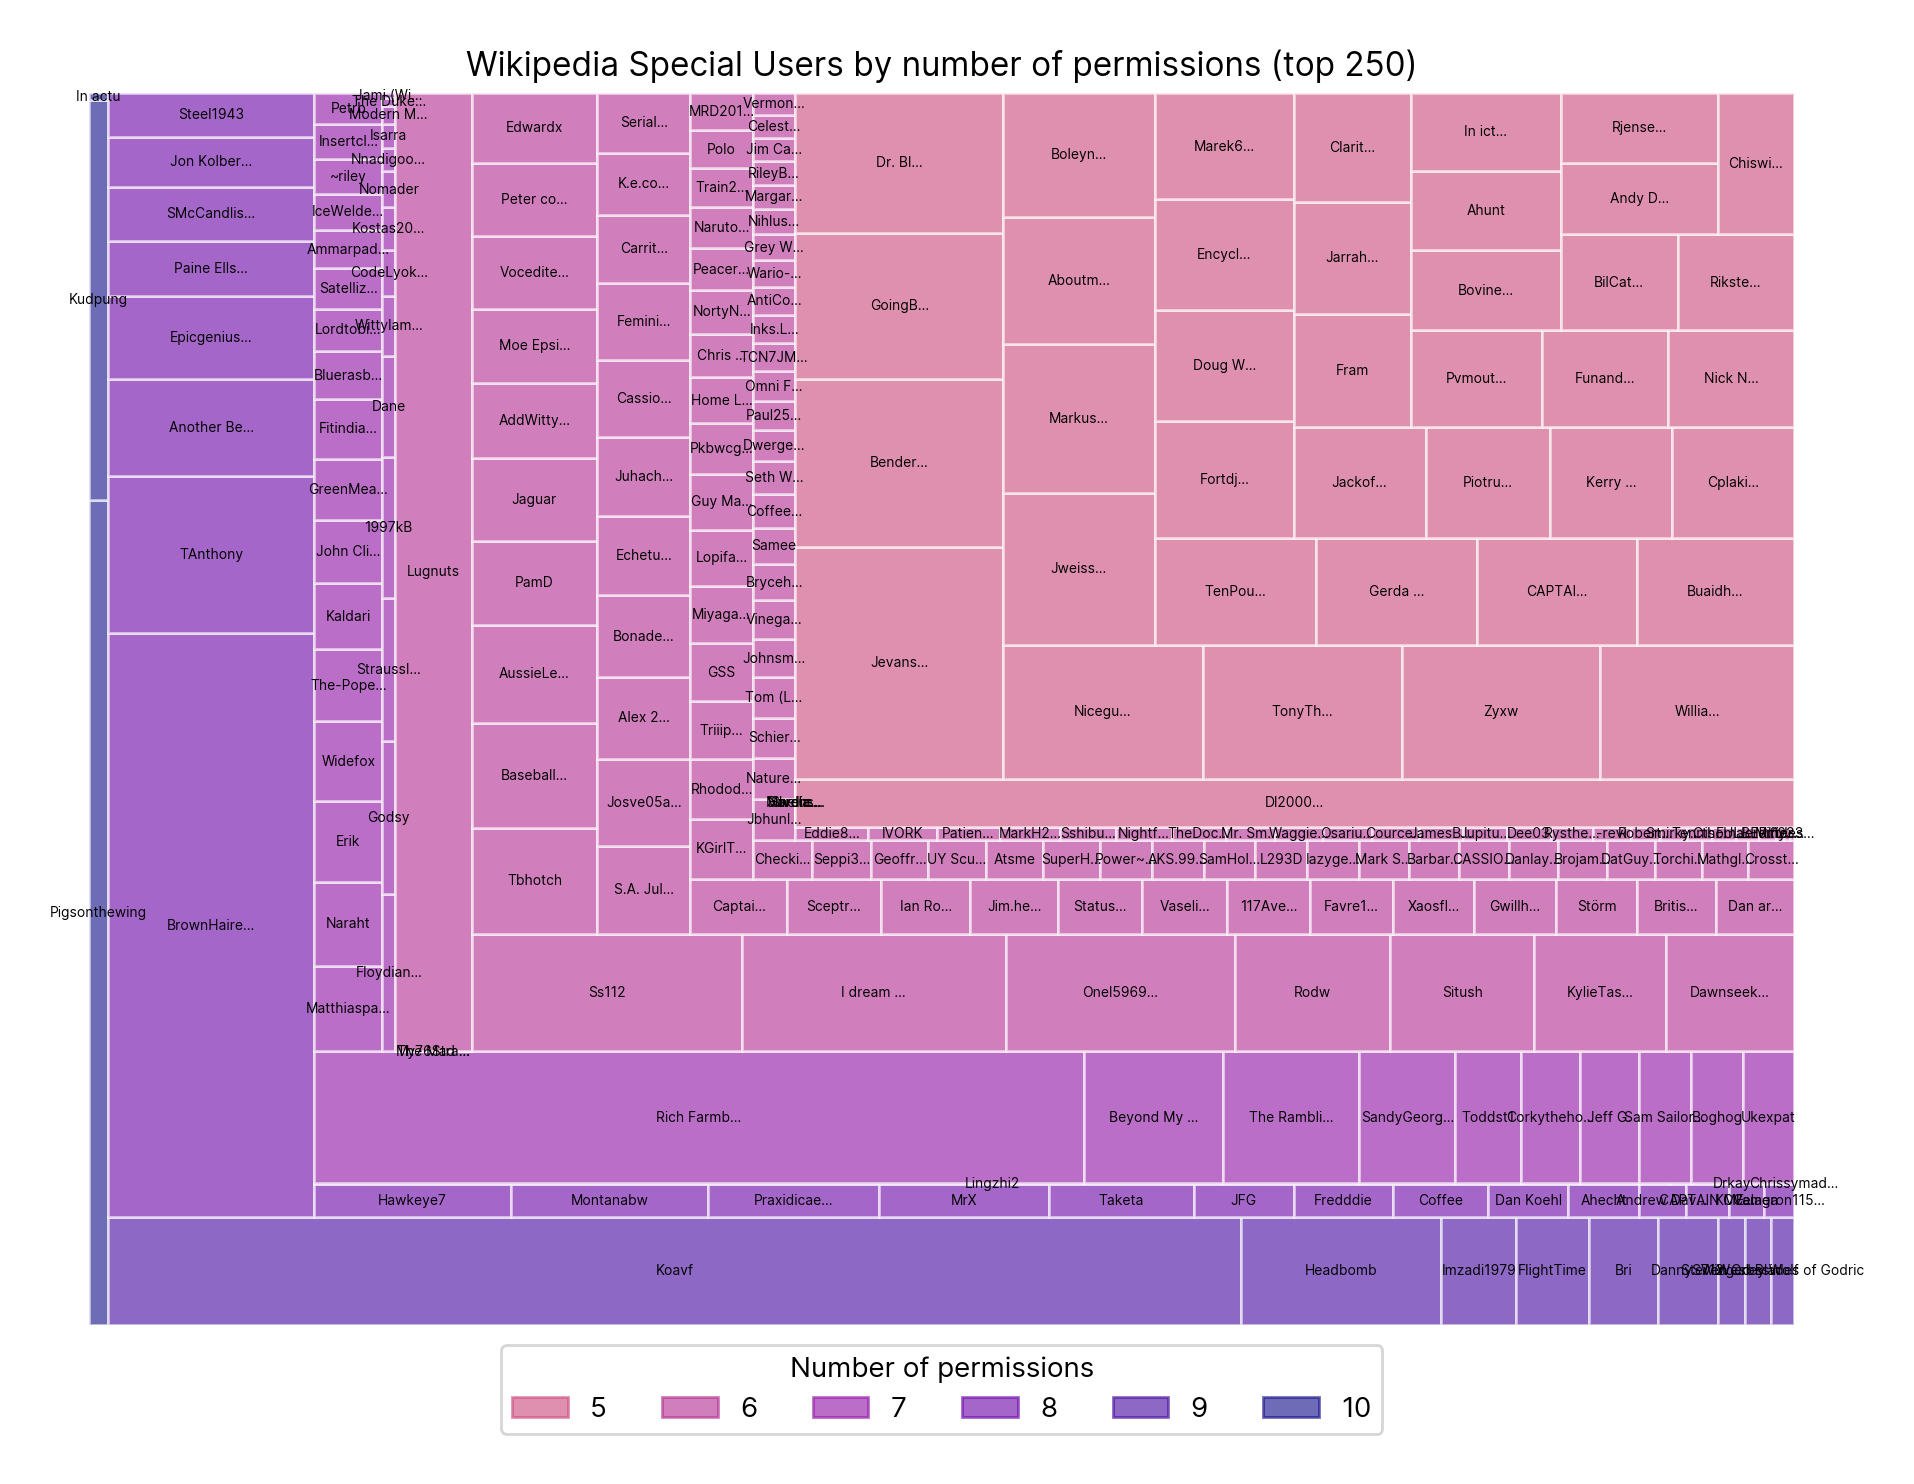
Figure 40.6
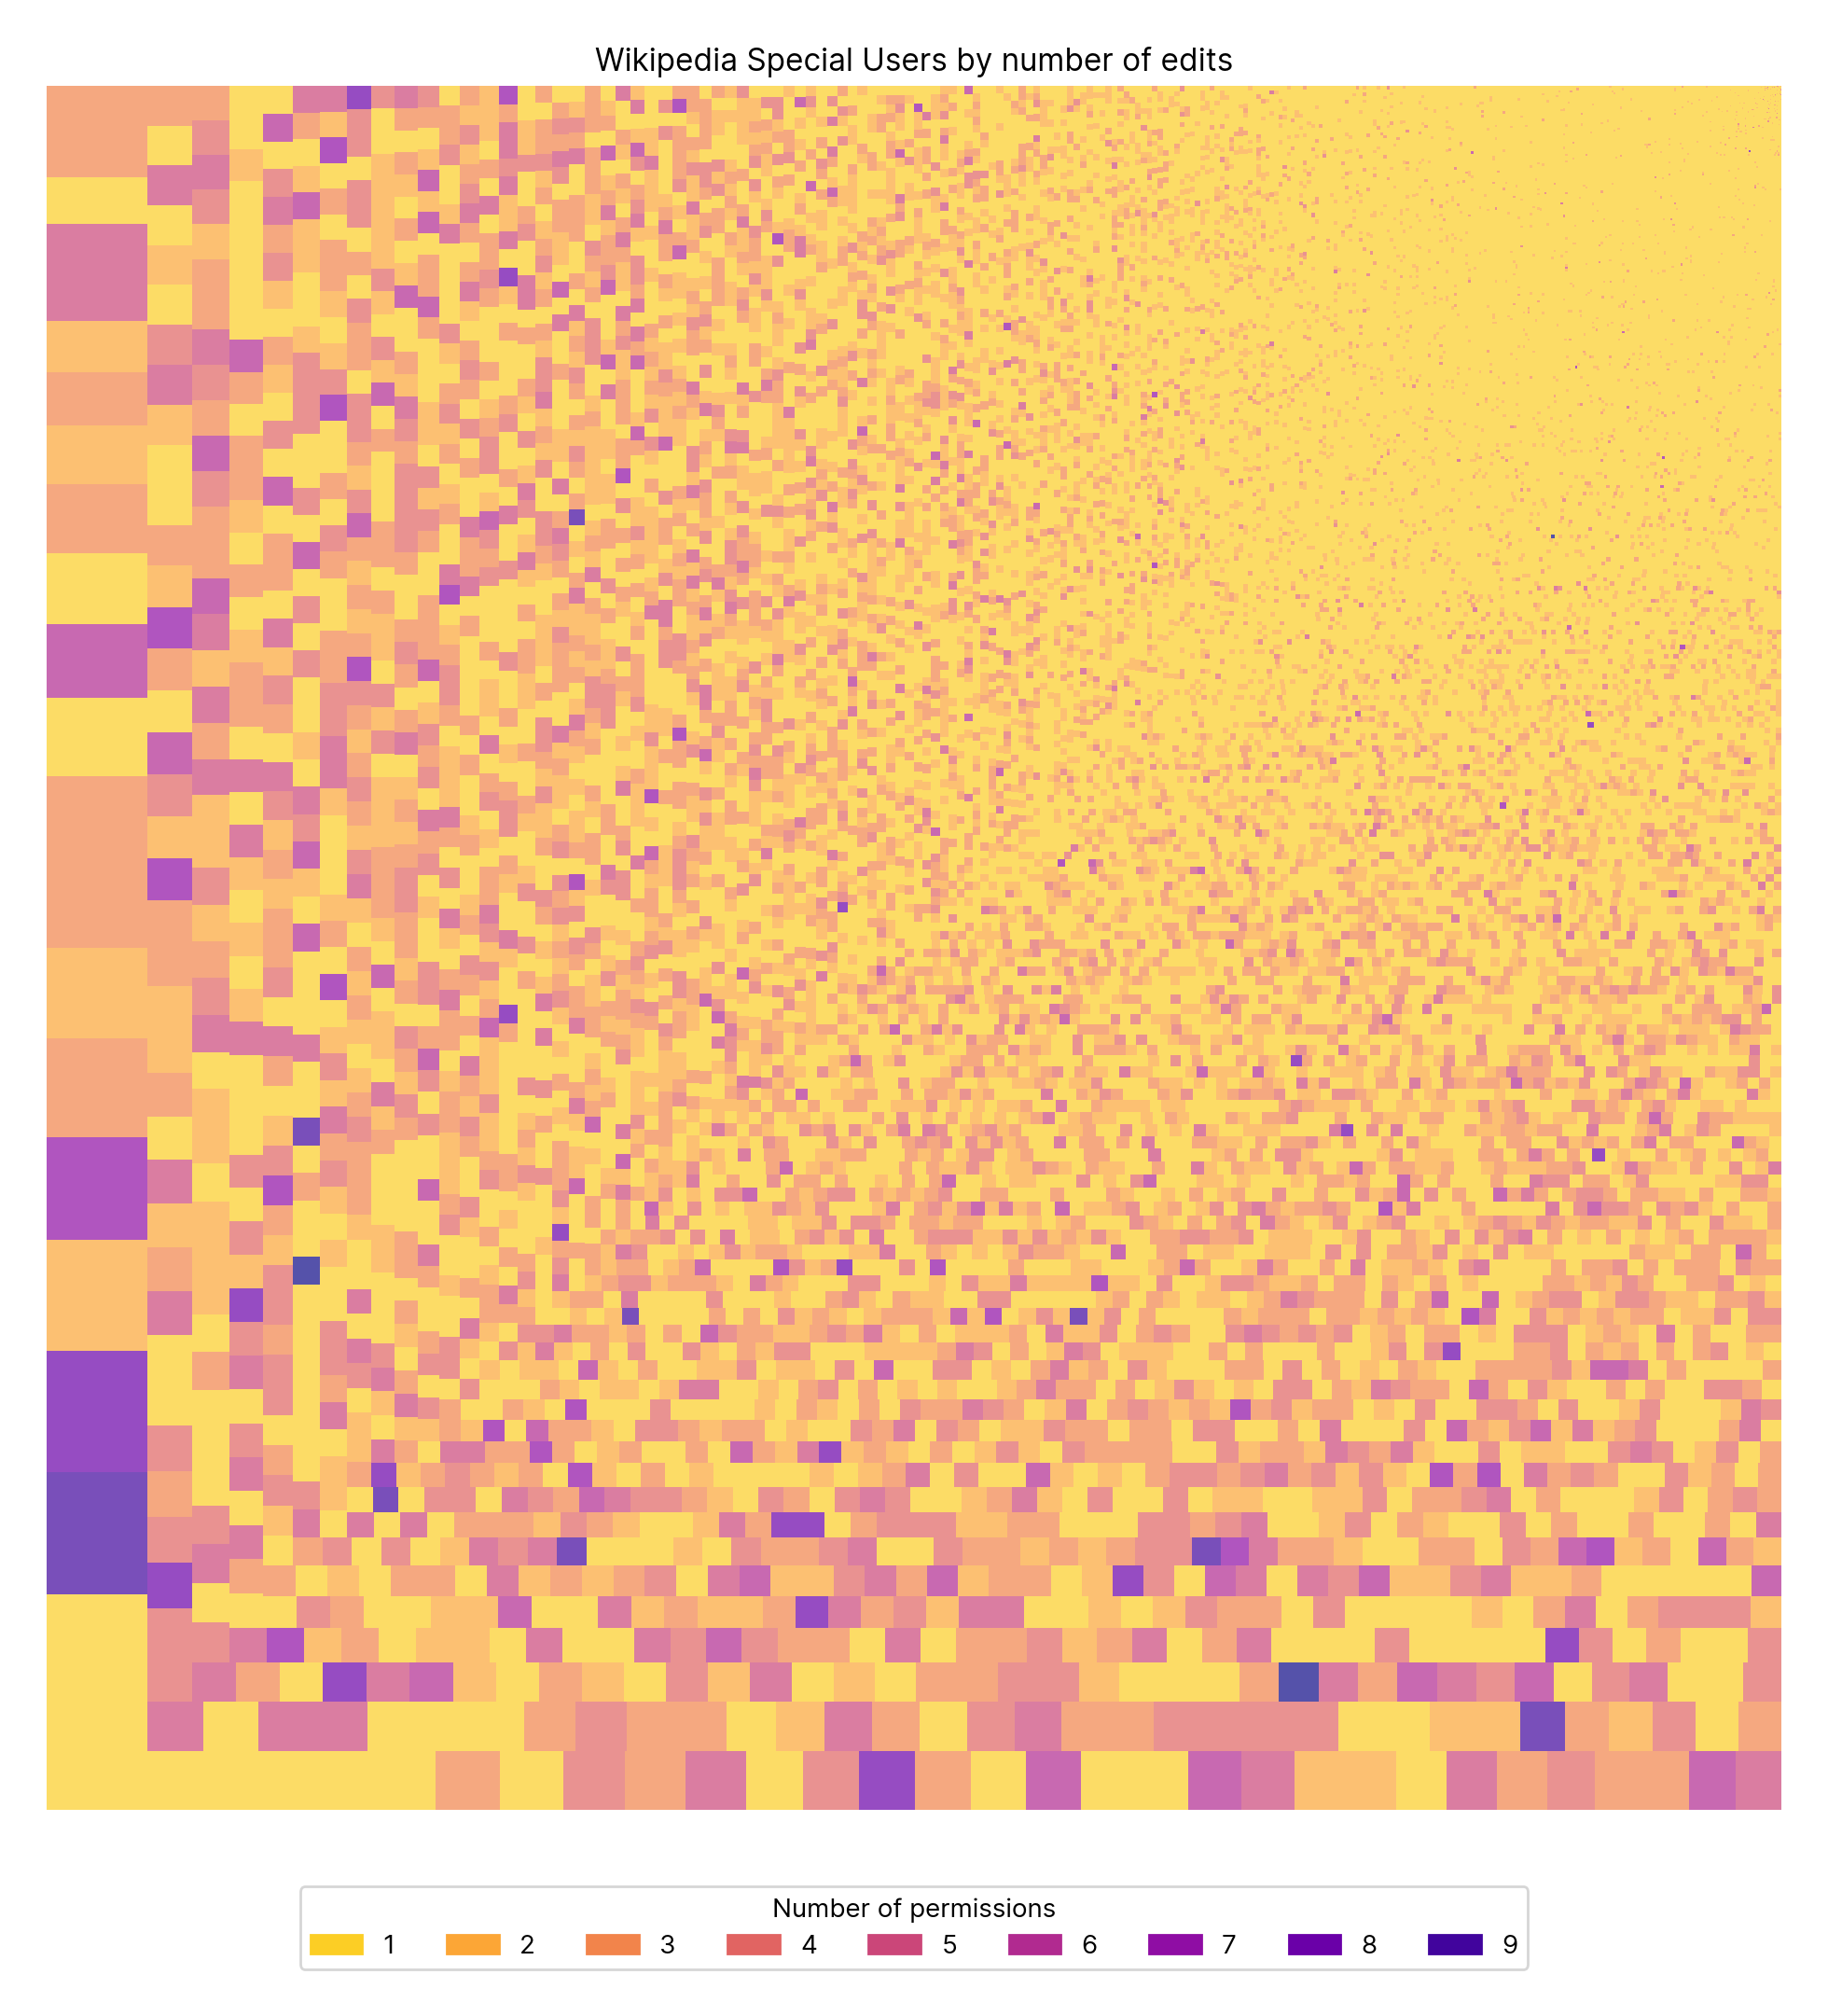
Figure 40.7
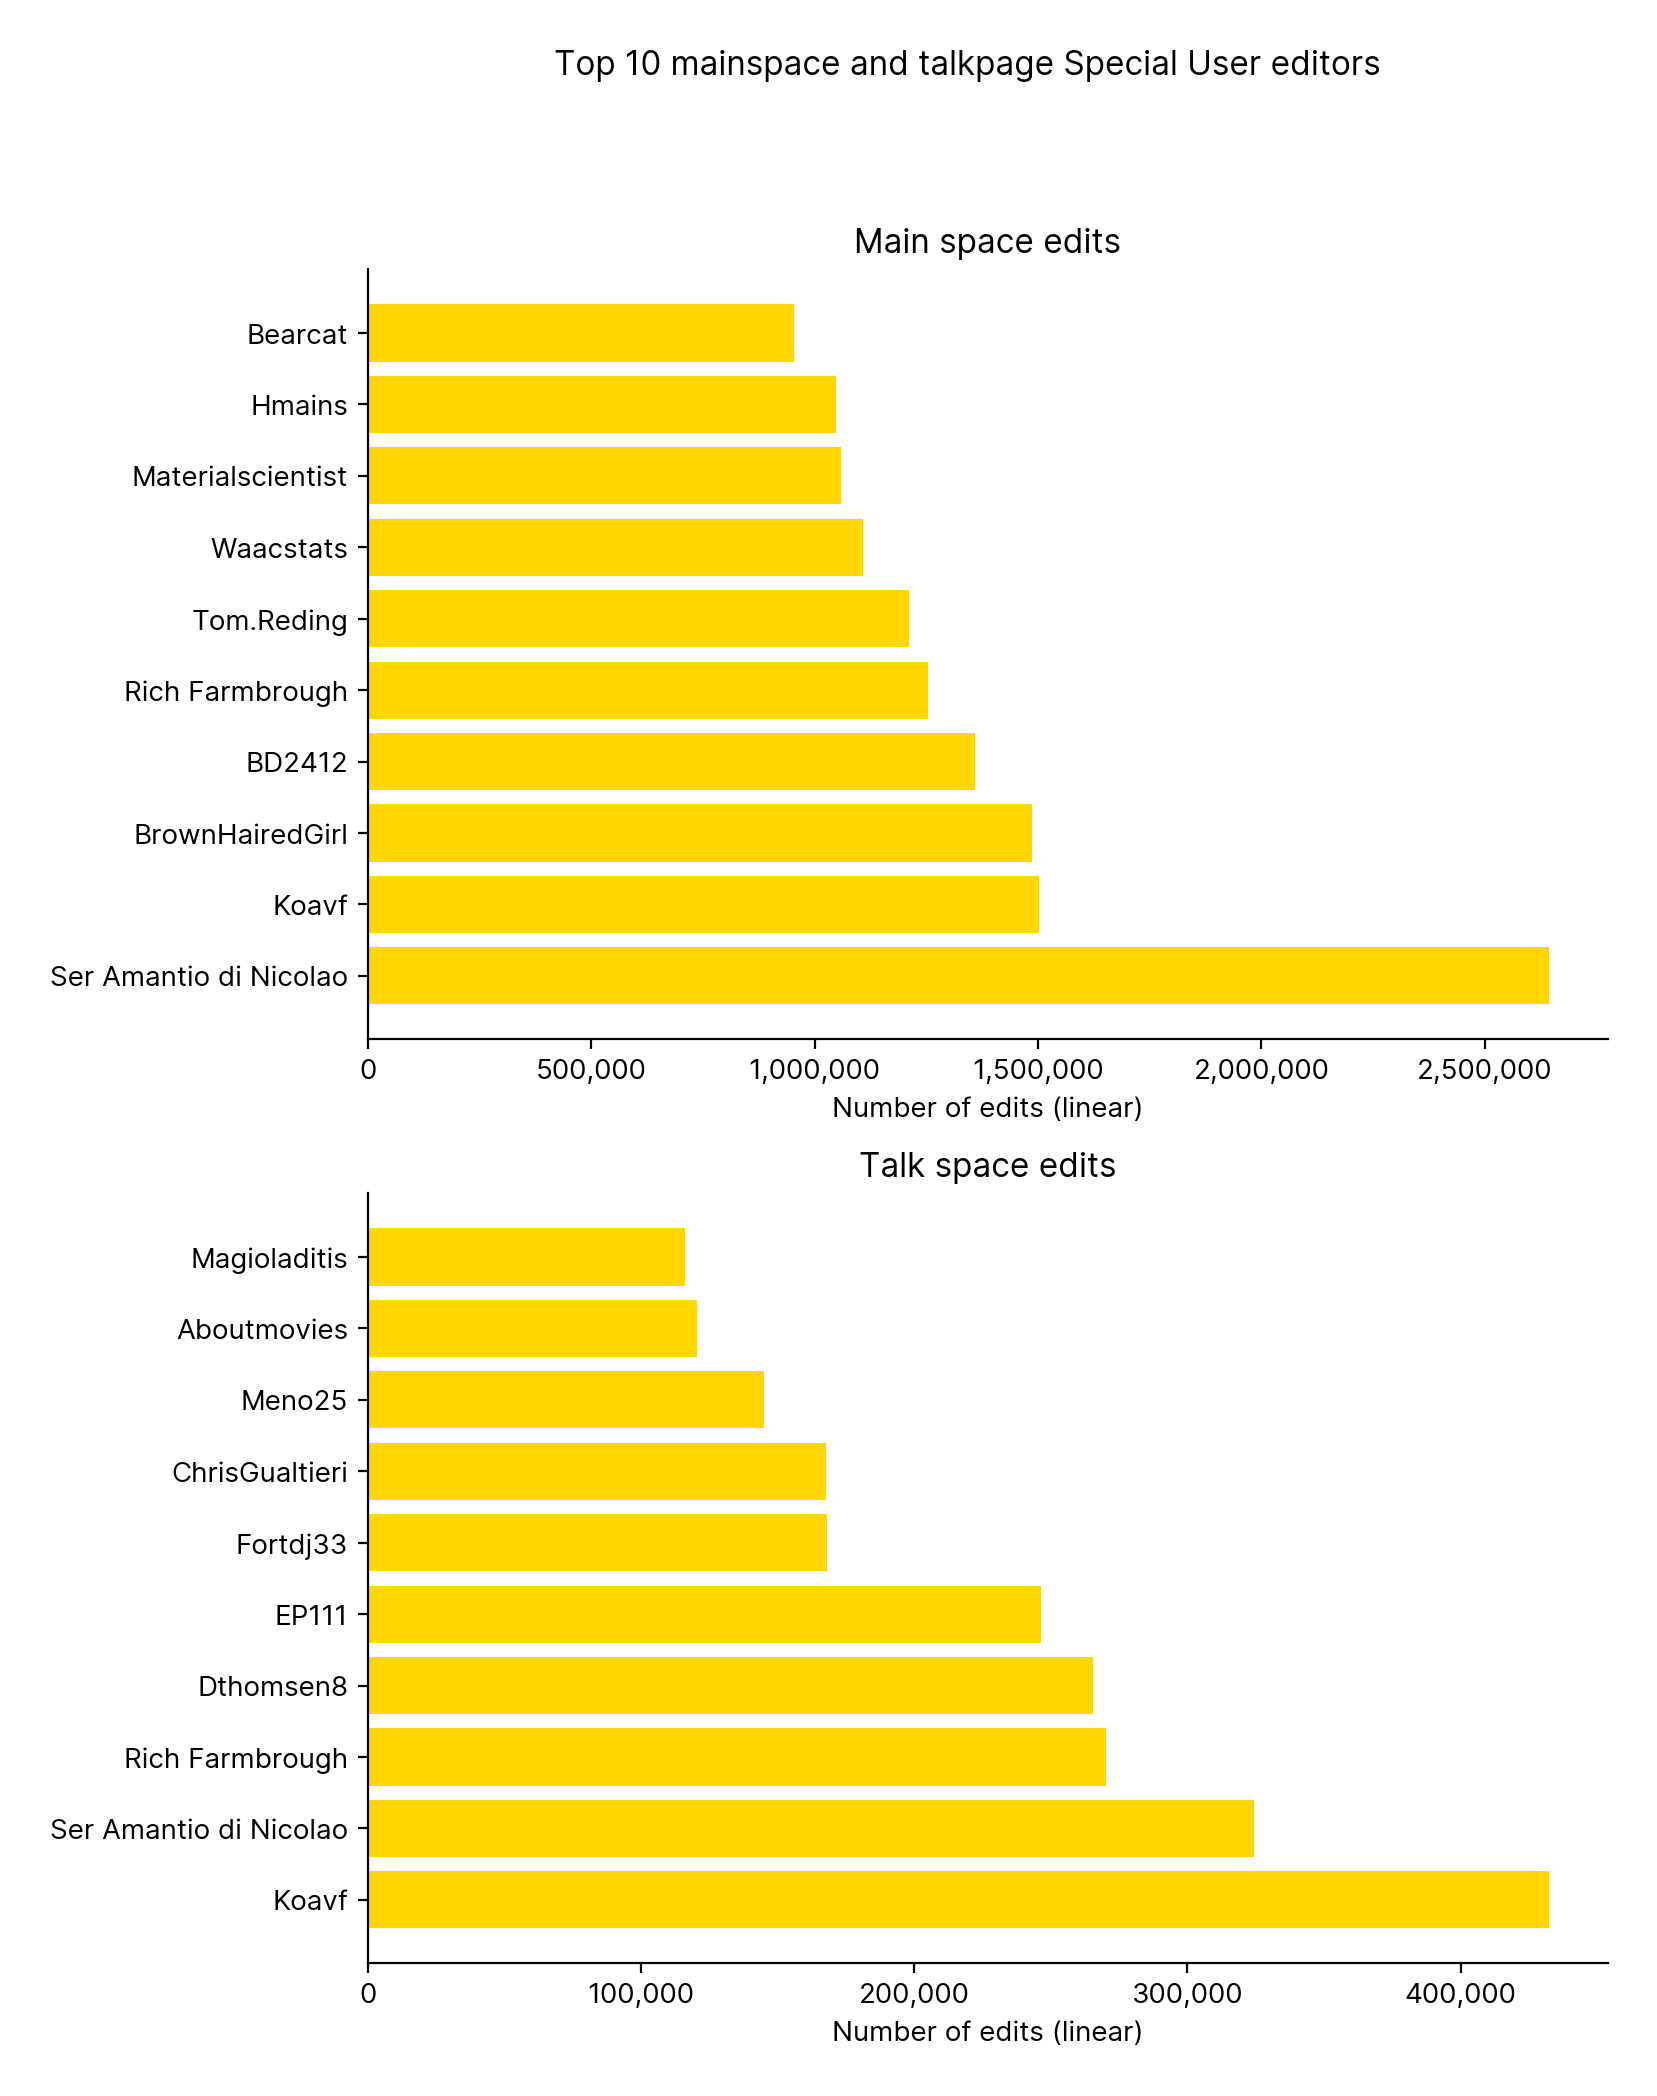
Figure 5.1
Ser Amantio di Nicolao, Koavf, and Rich Farmbrough are the only editors to appear in both graphs
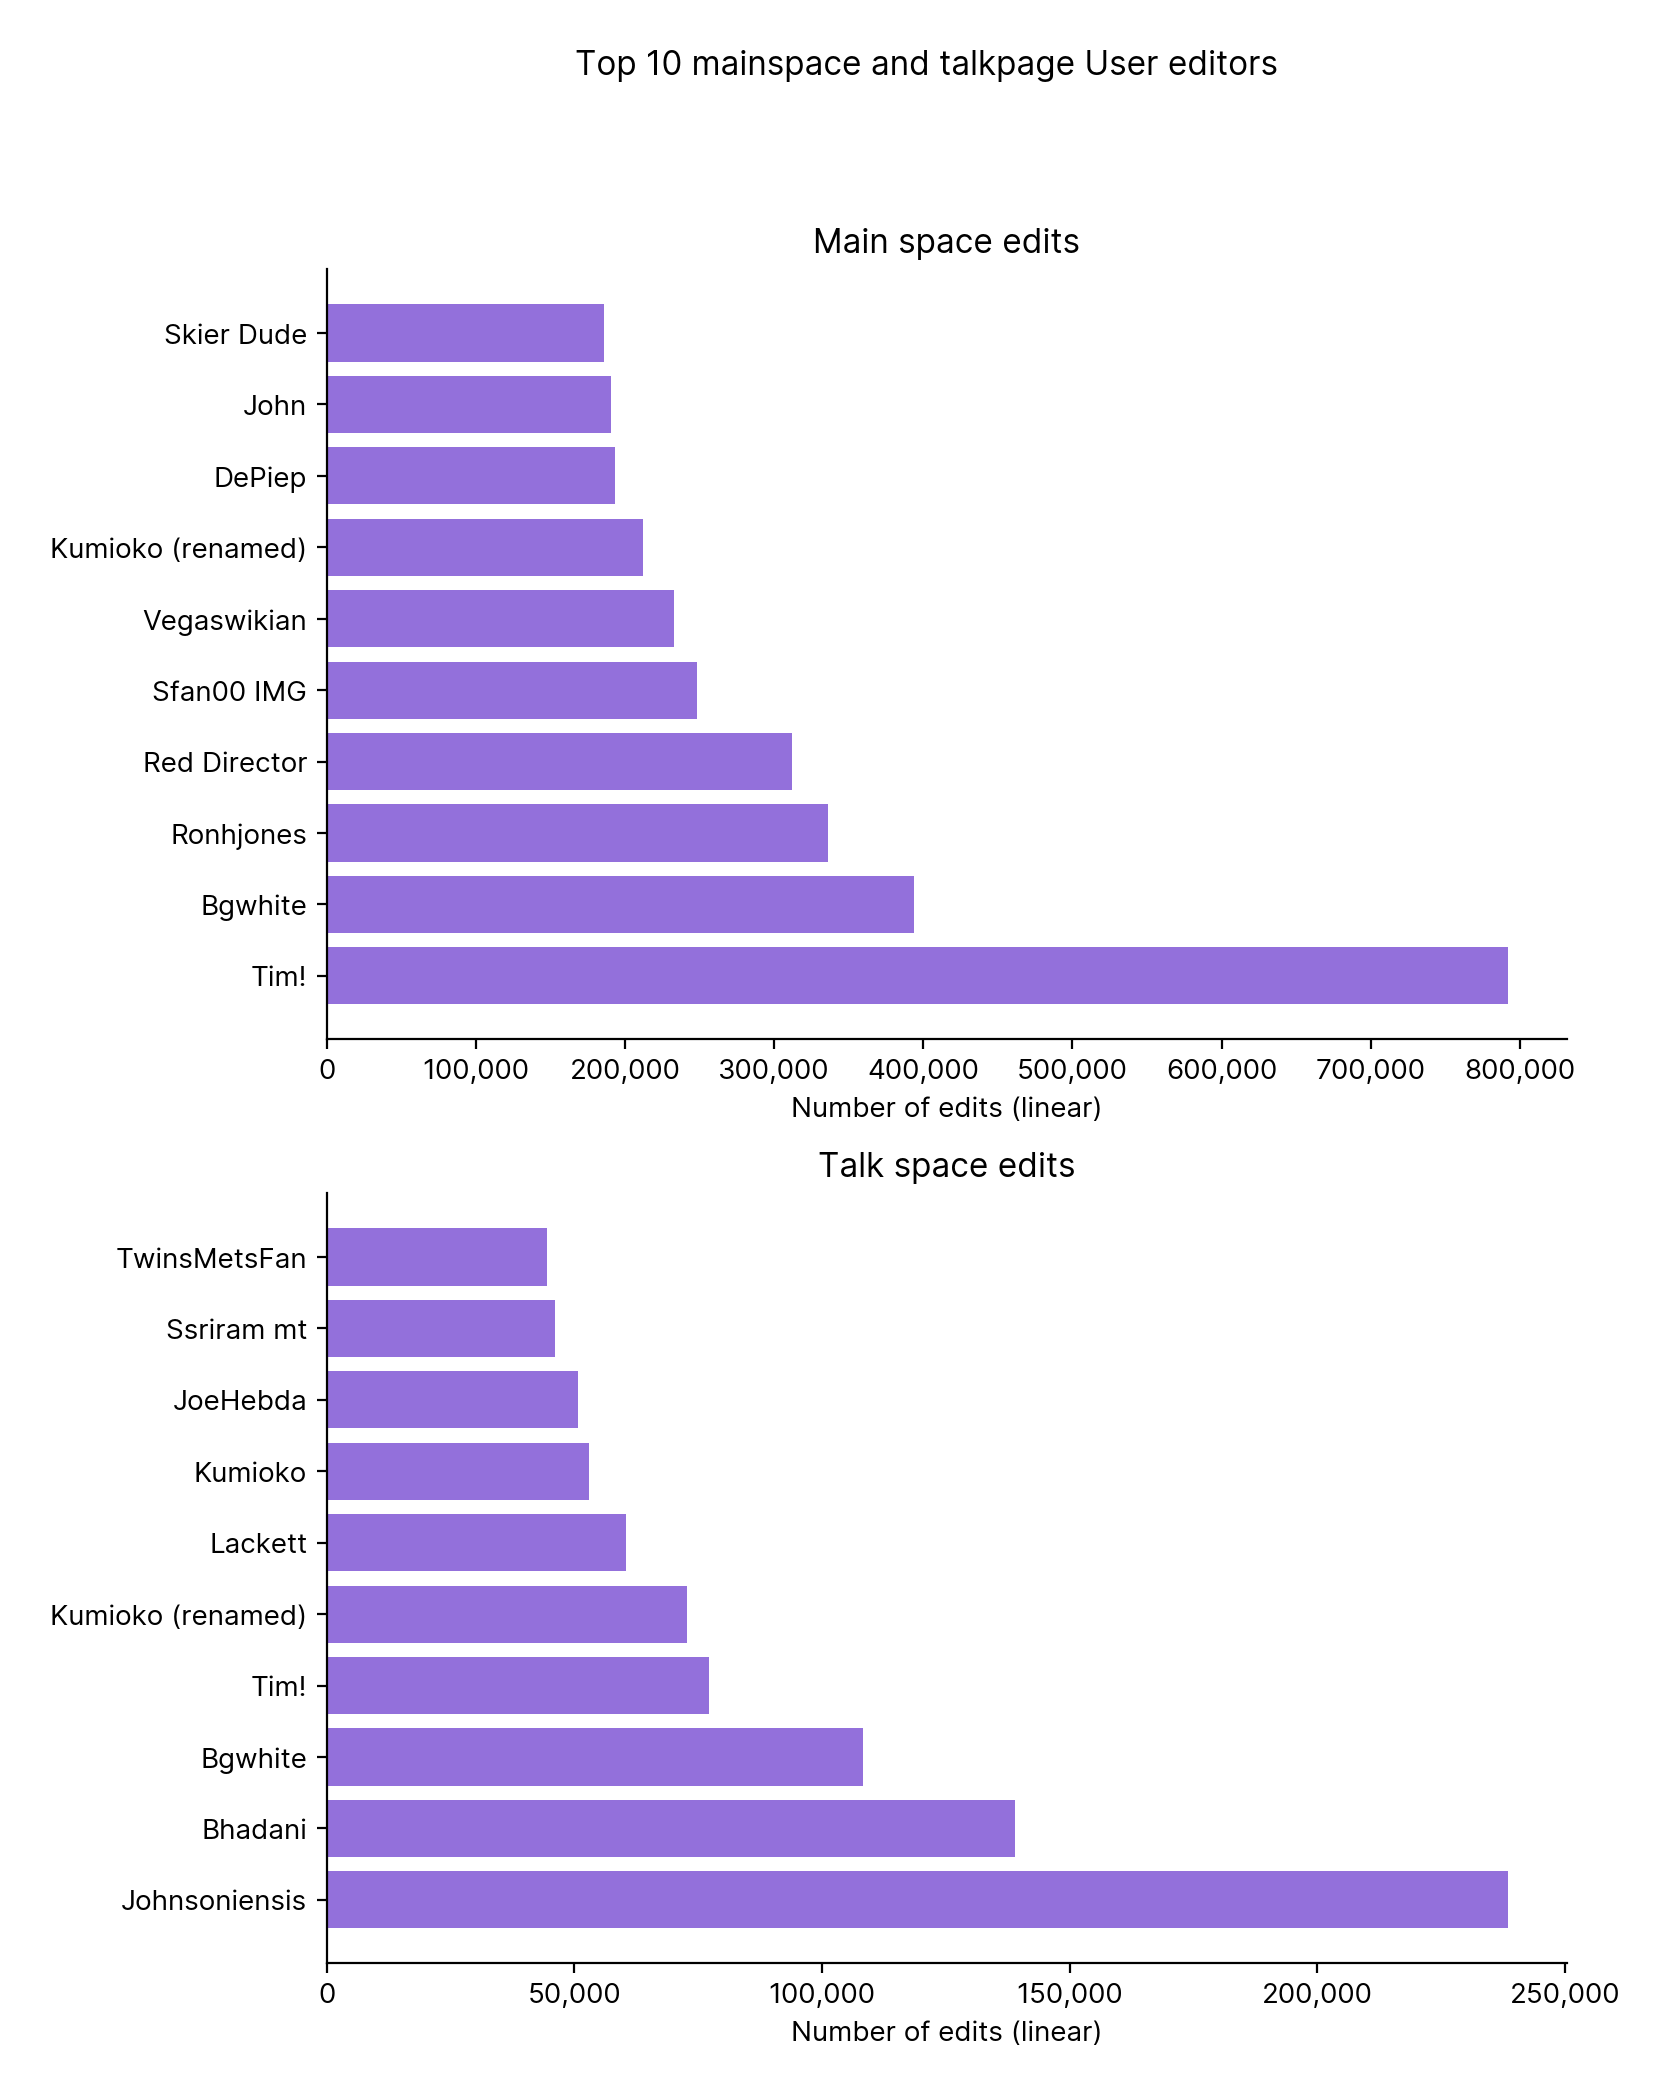
Figure 5.1
Figure 5.3
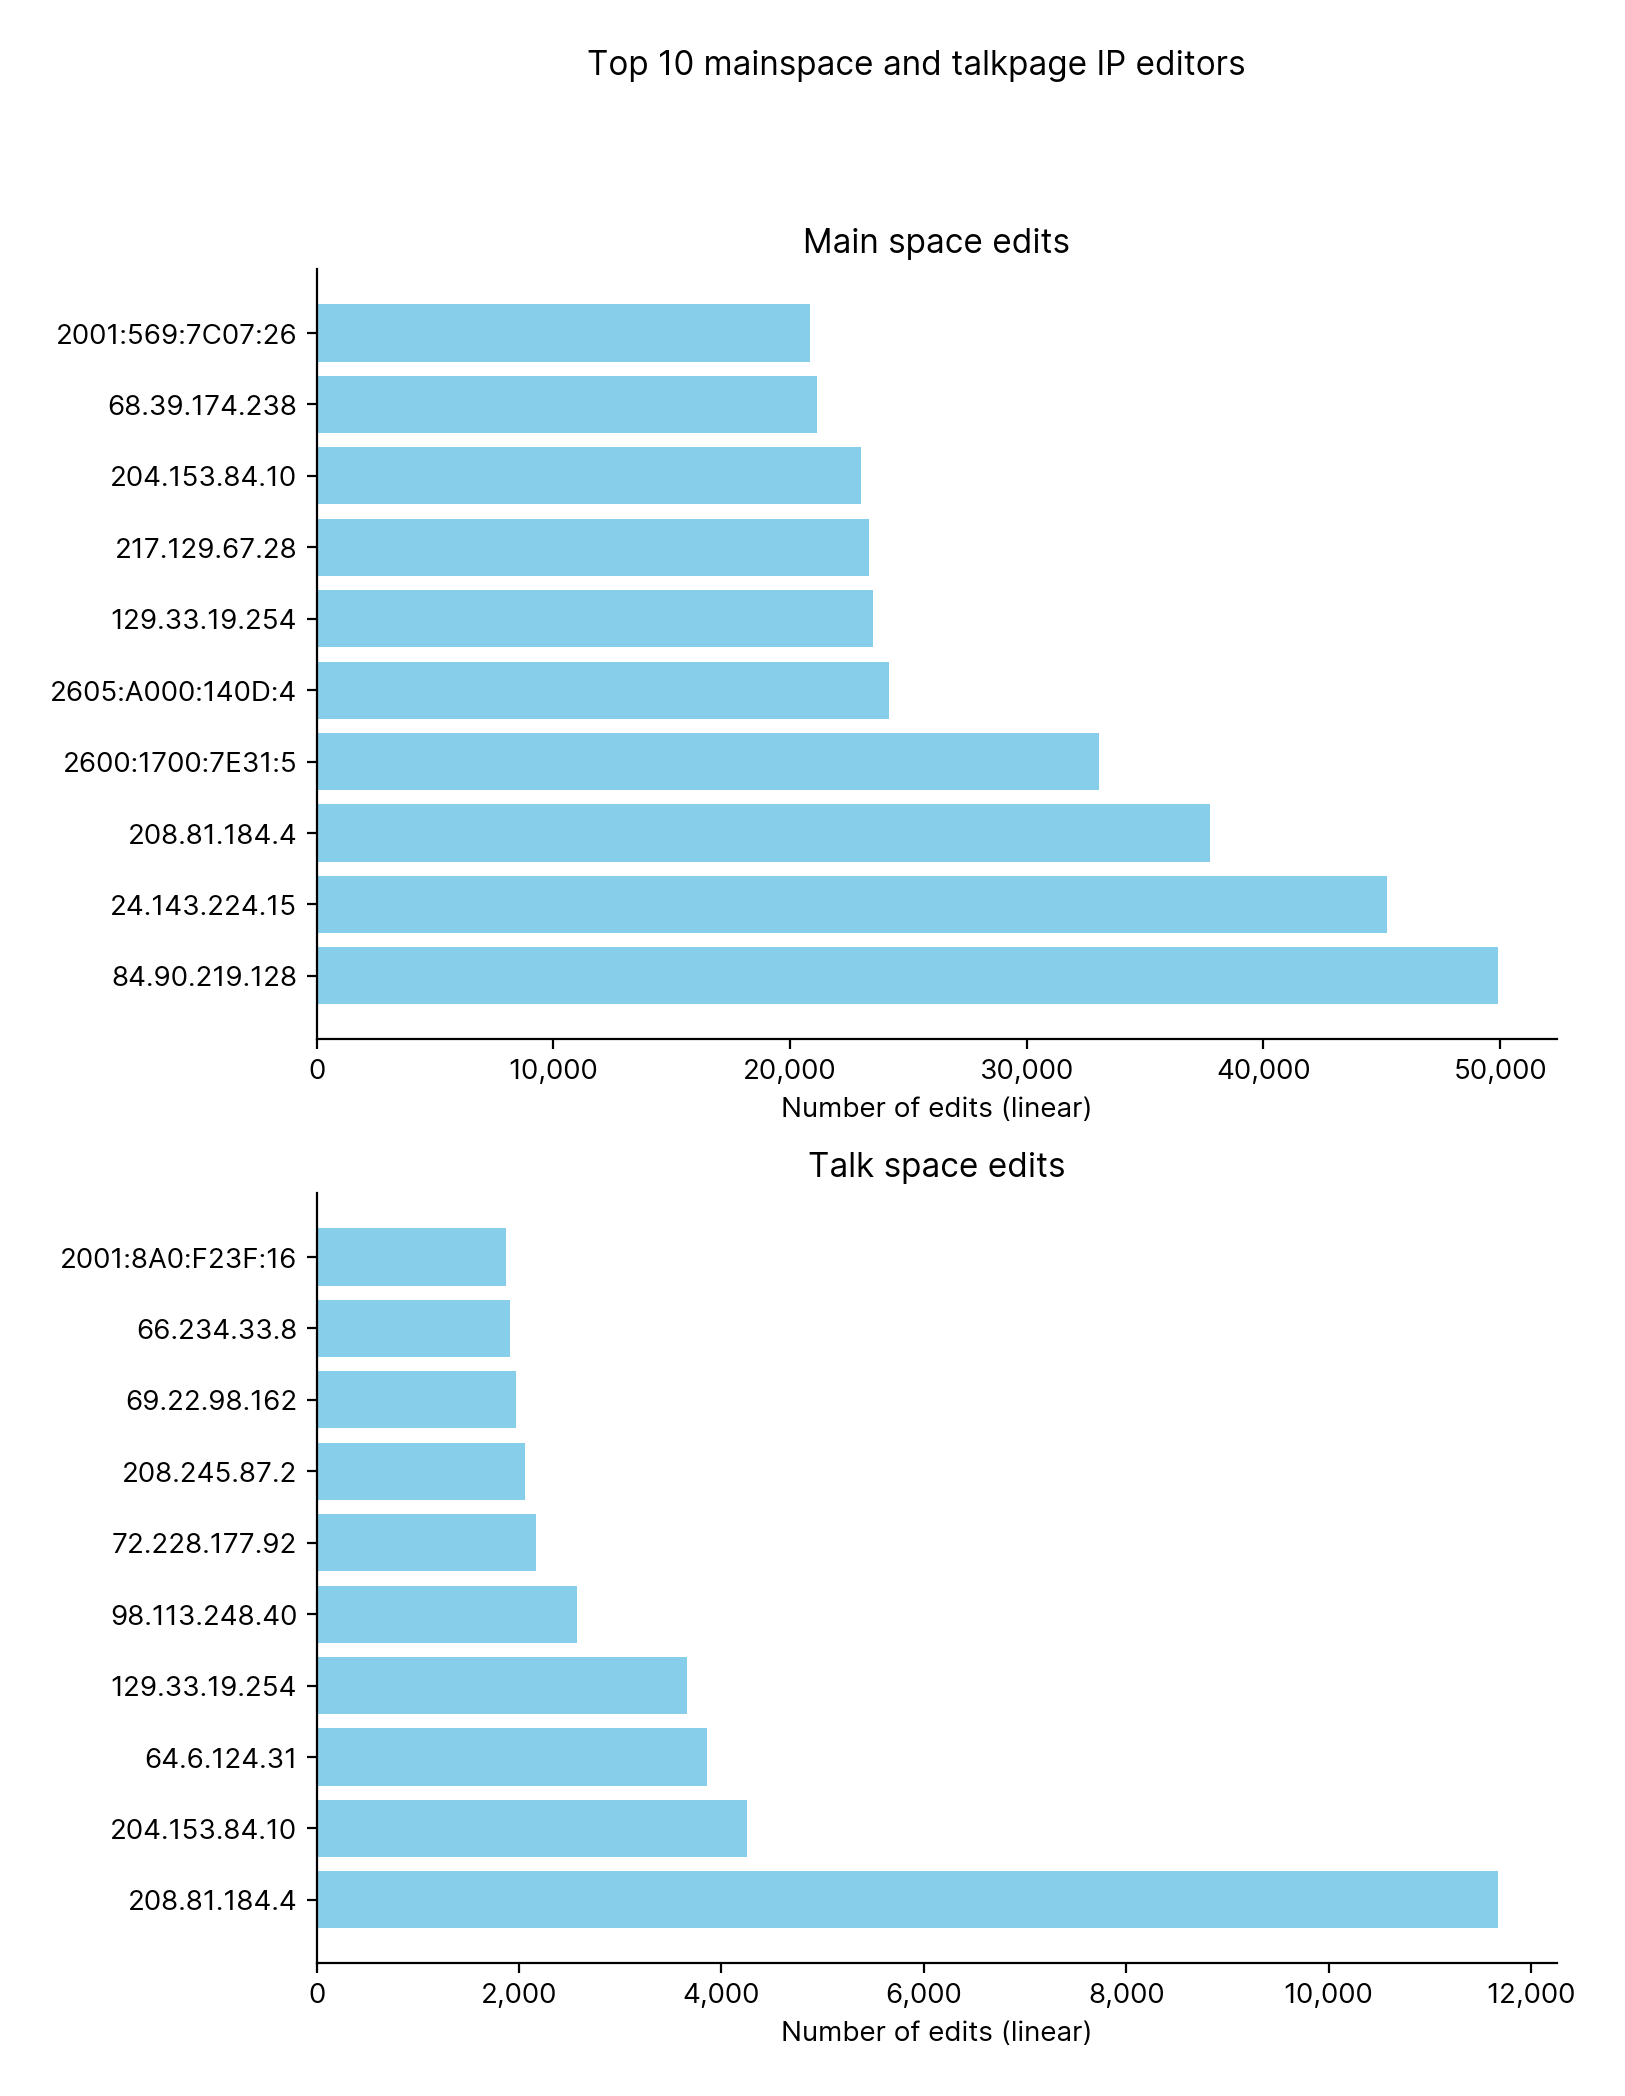
Figure 5.4
208.81.184.4, 129.33.19.294 and 204.153.84.10 are the only editors to appear in both graphs
Figure 5.5
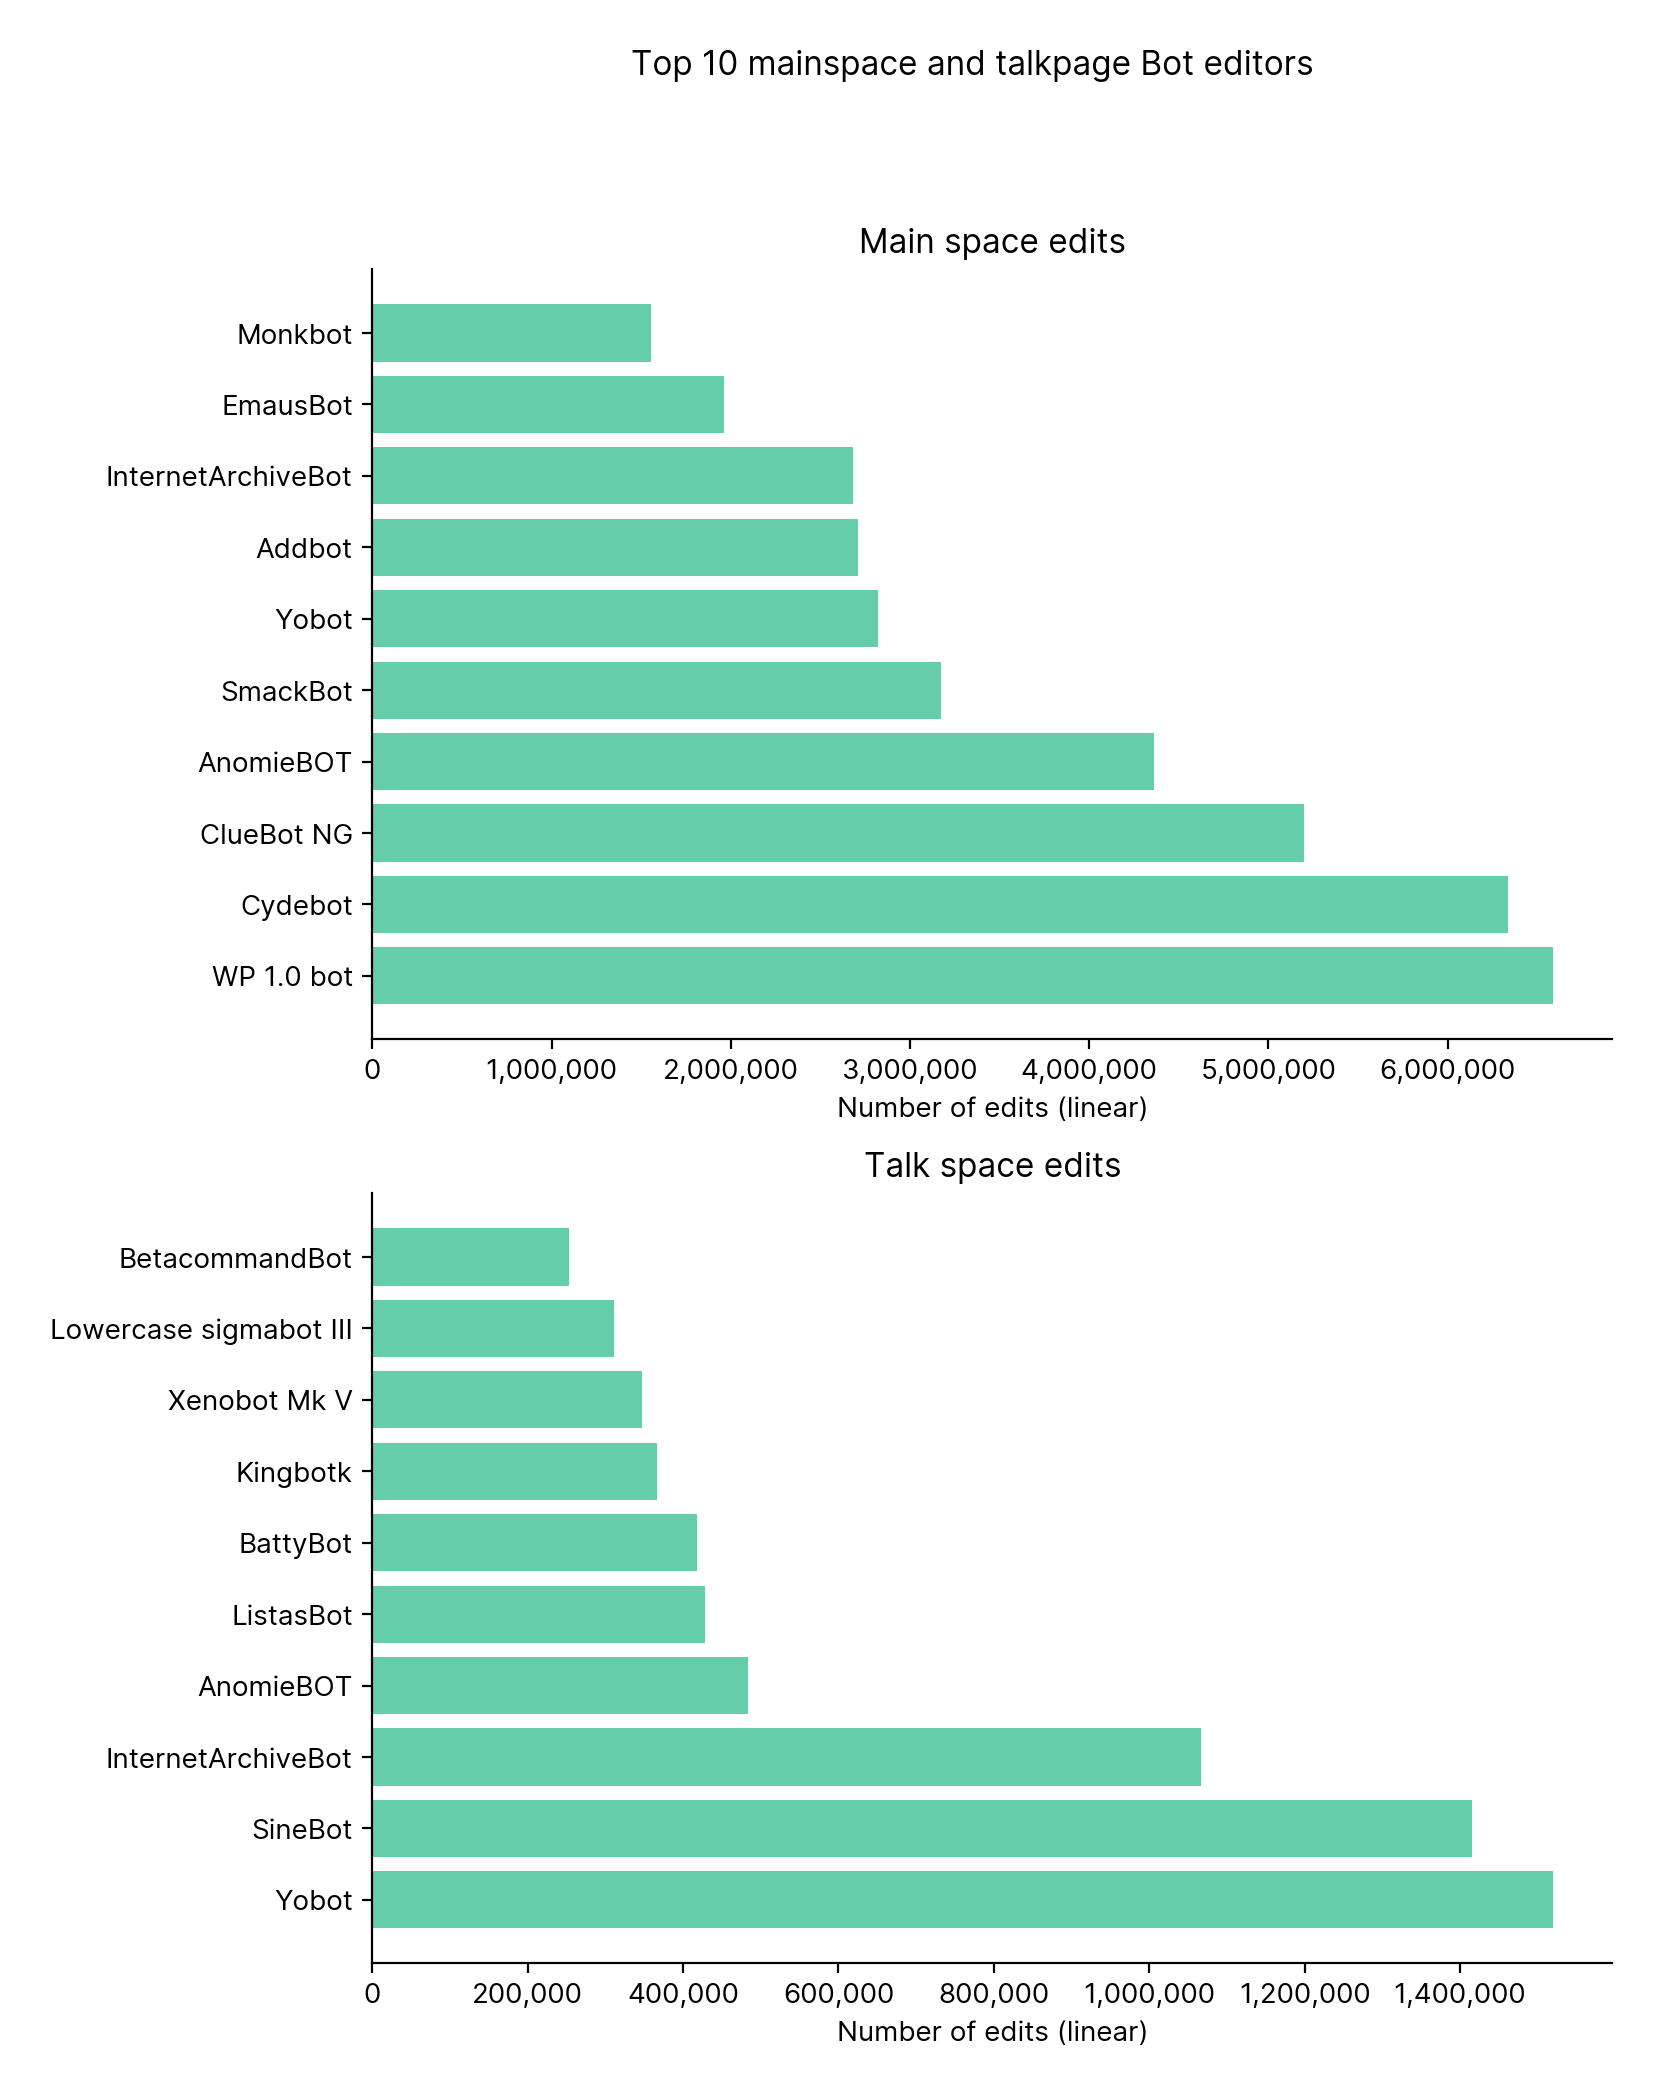
Figure 5.6
AnomieBTO, Yobot and InternetArchiveBot are the only editors to appear in both graphs.
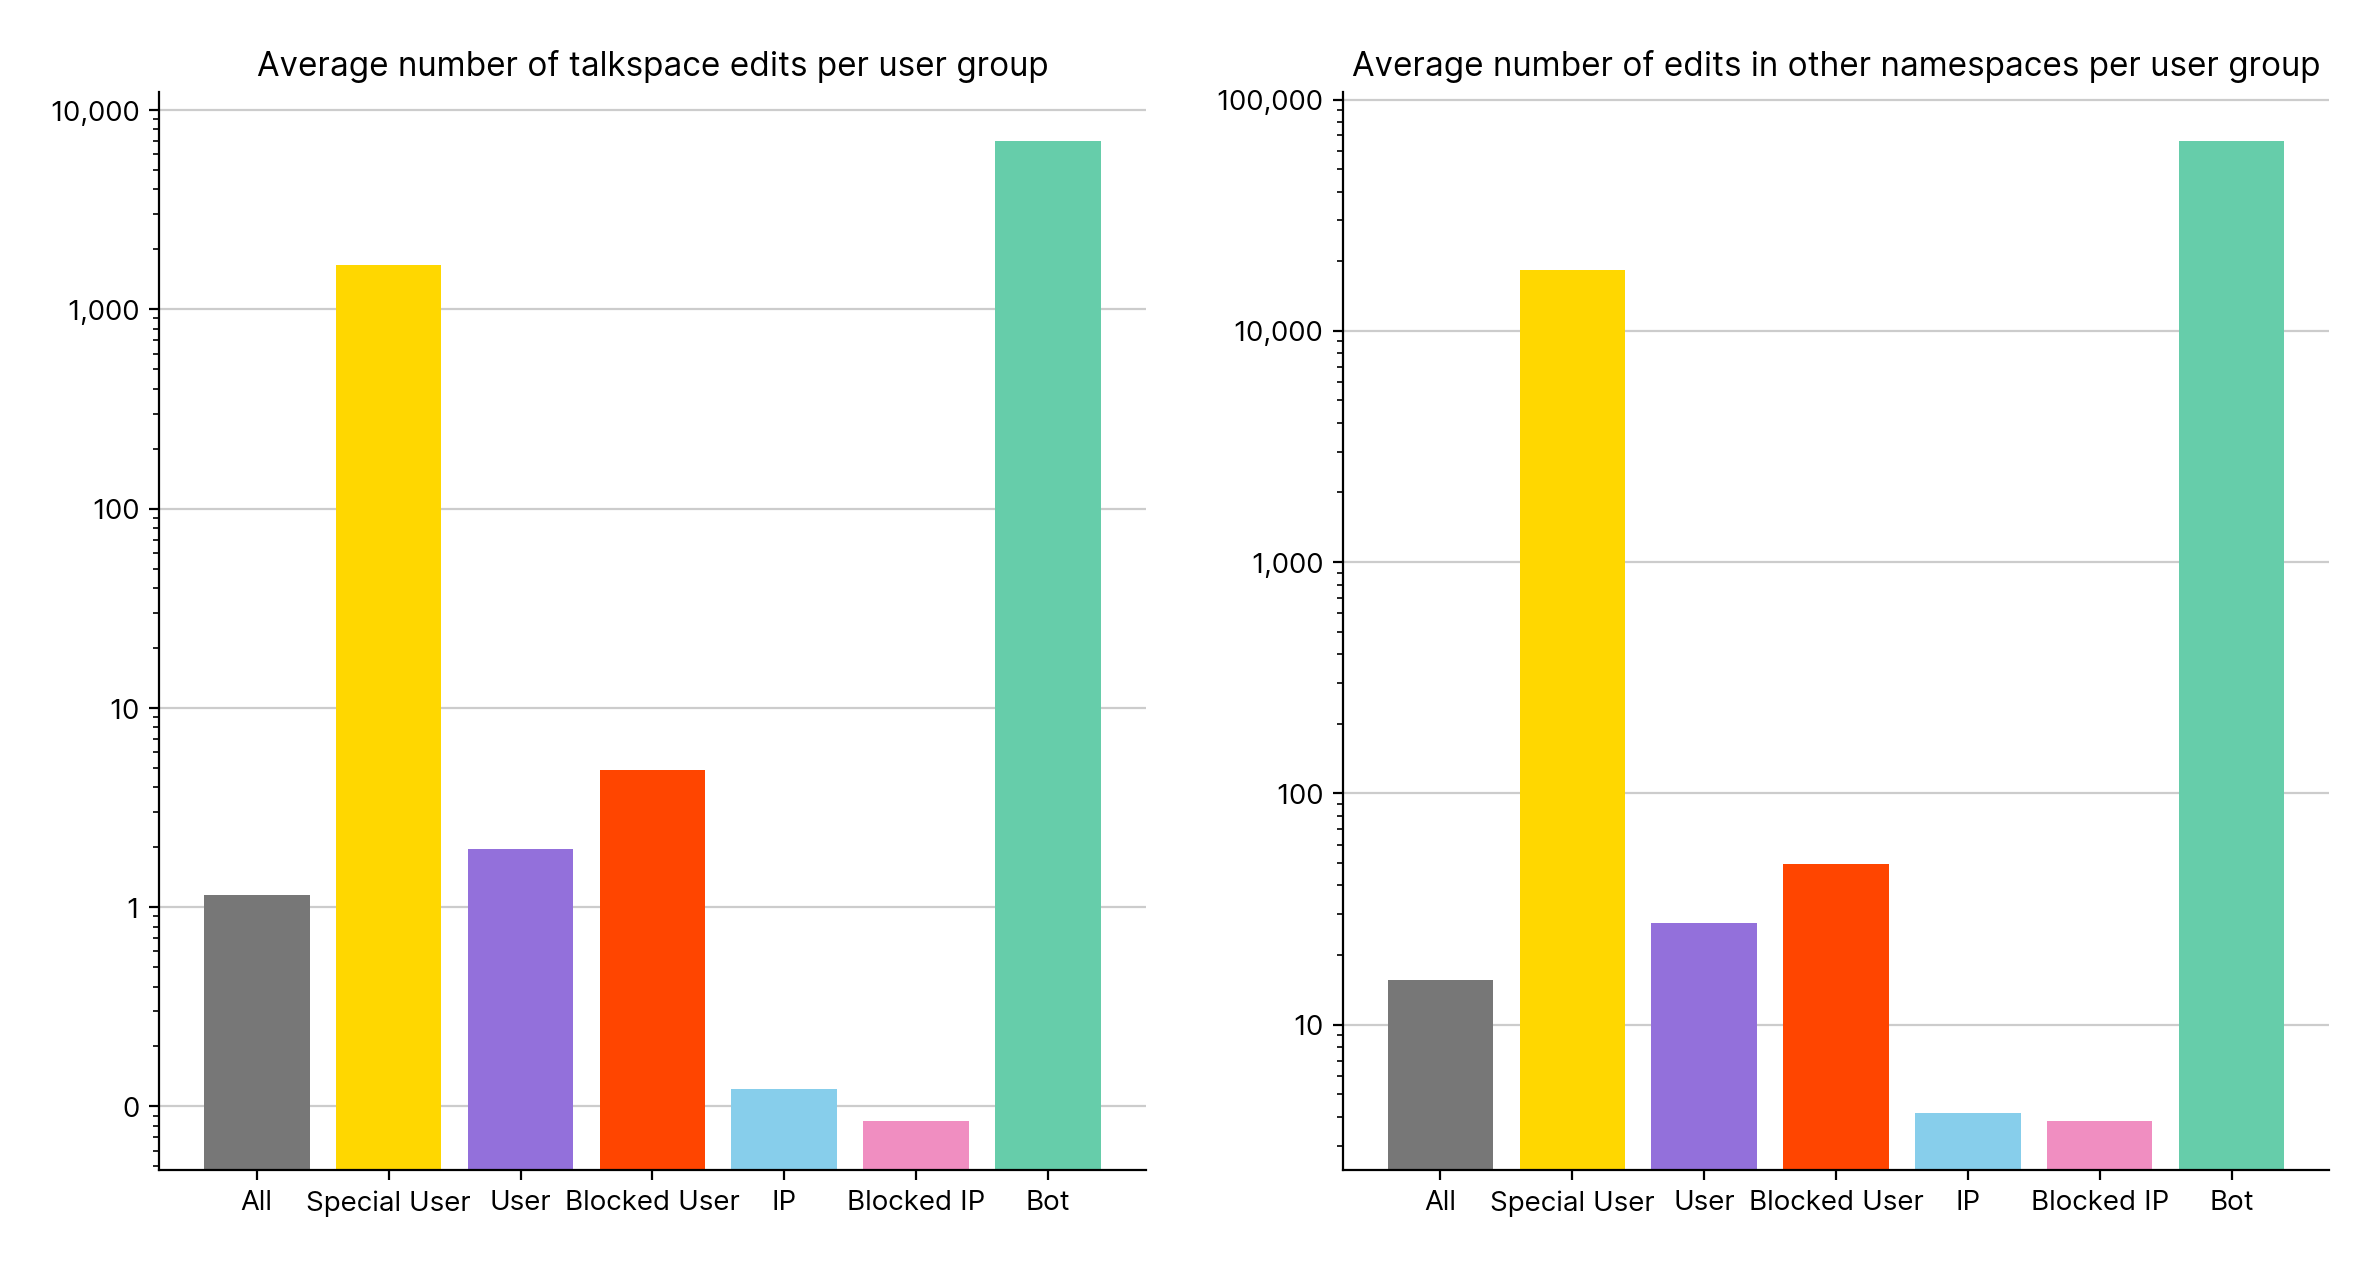
Figure 6
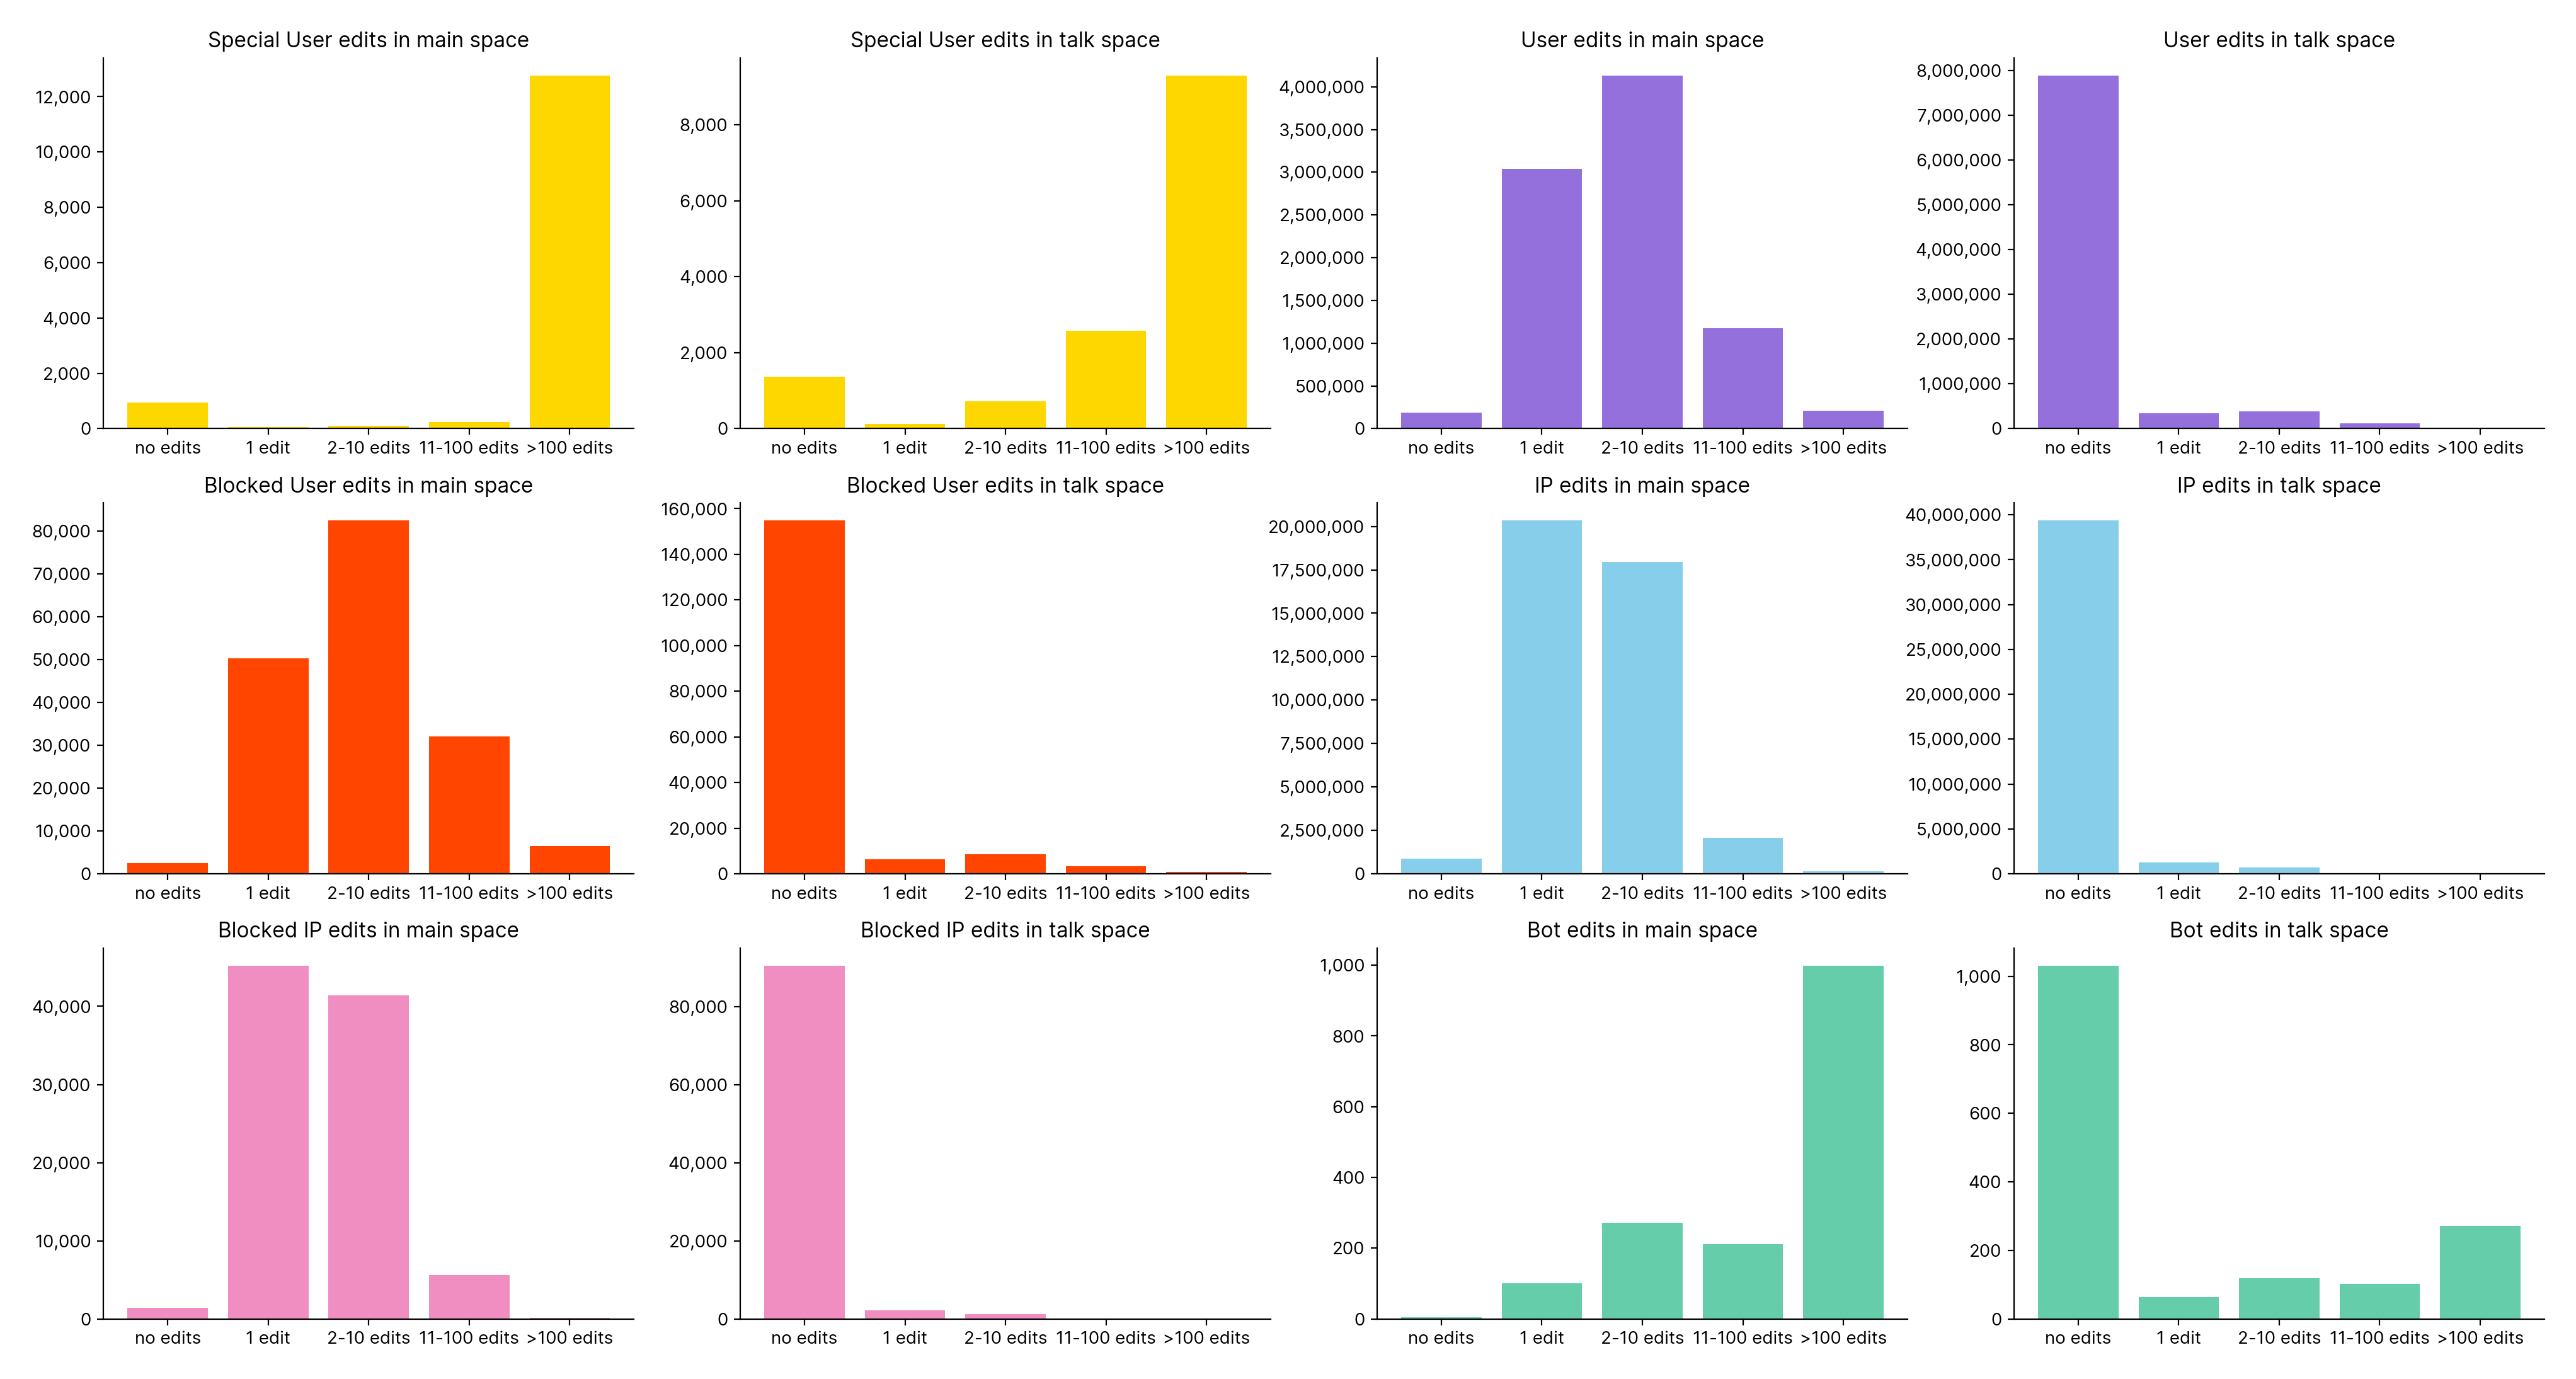
Figure 8
We have mainspace edits on the left and talkpage edits on the right, and each column is a different user group. Each group seems to have different peak in main space edits, with blocked being a subset of the user distribution. Bots are the most different group of editors which follows intuition.
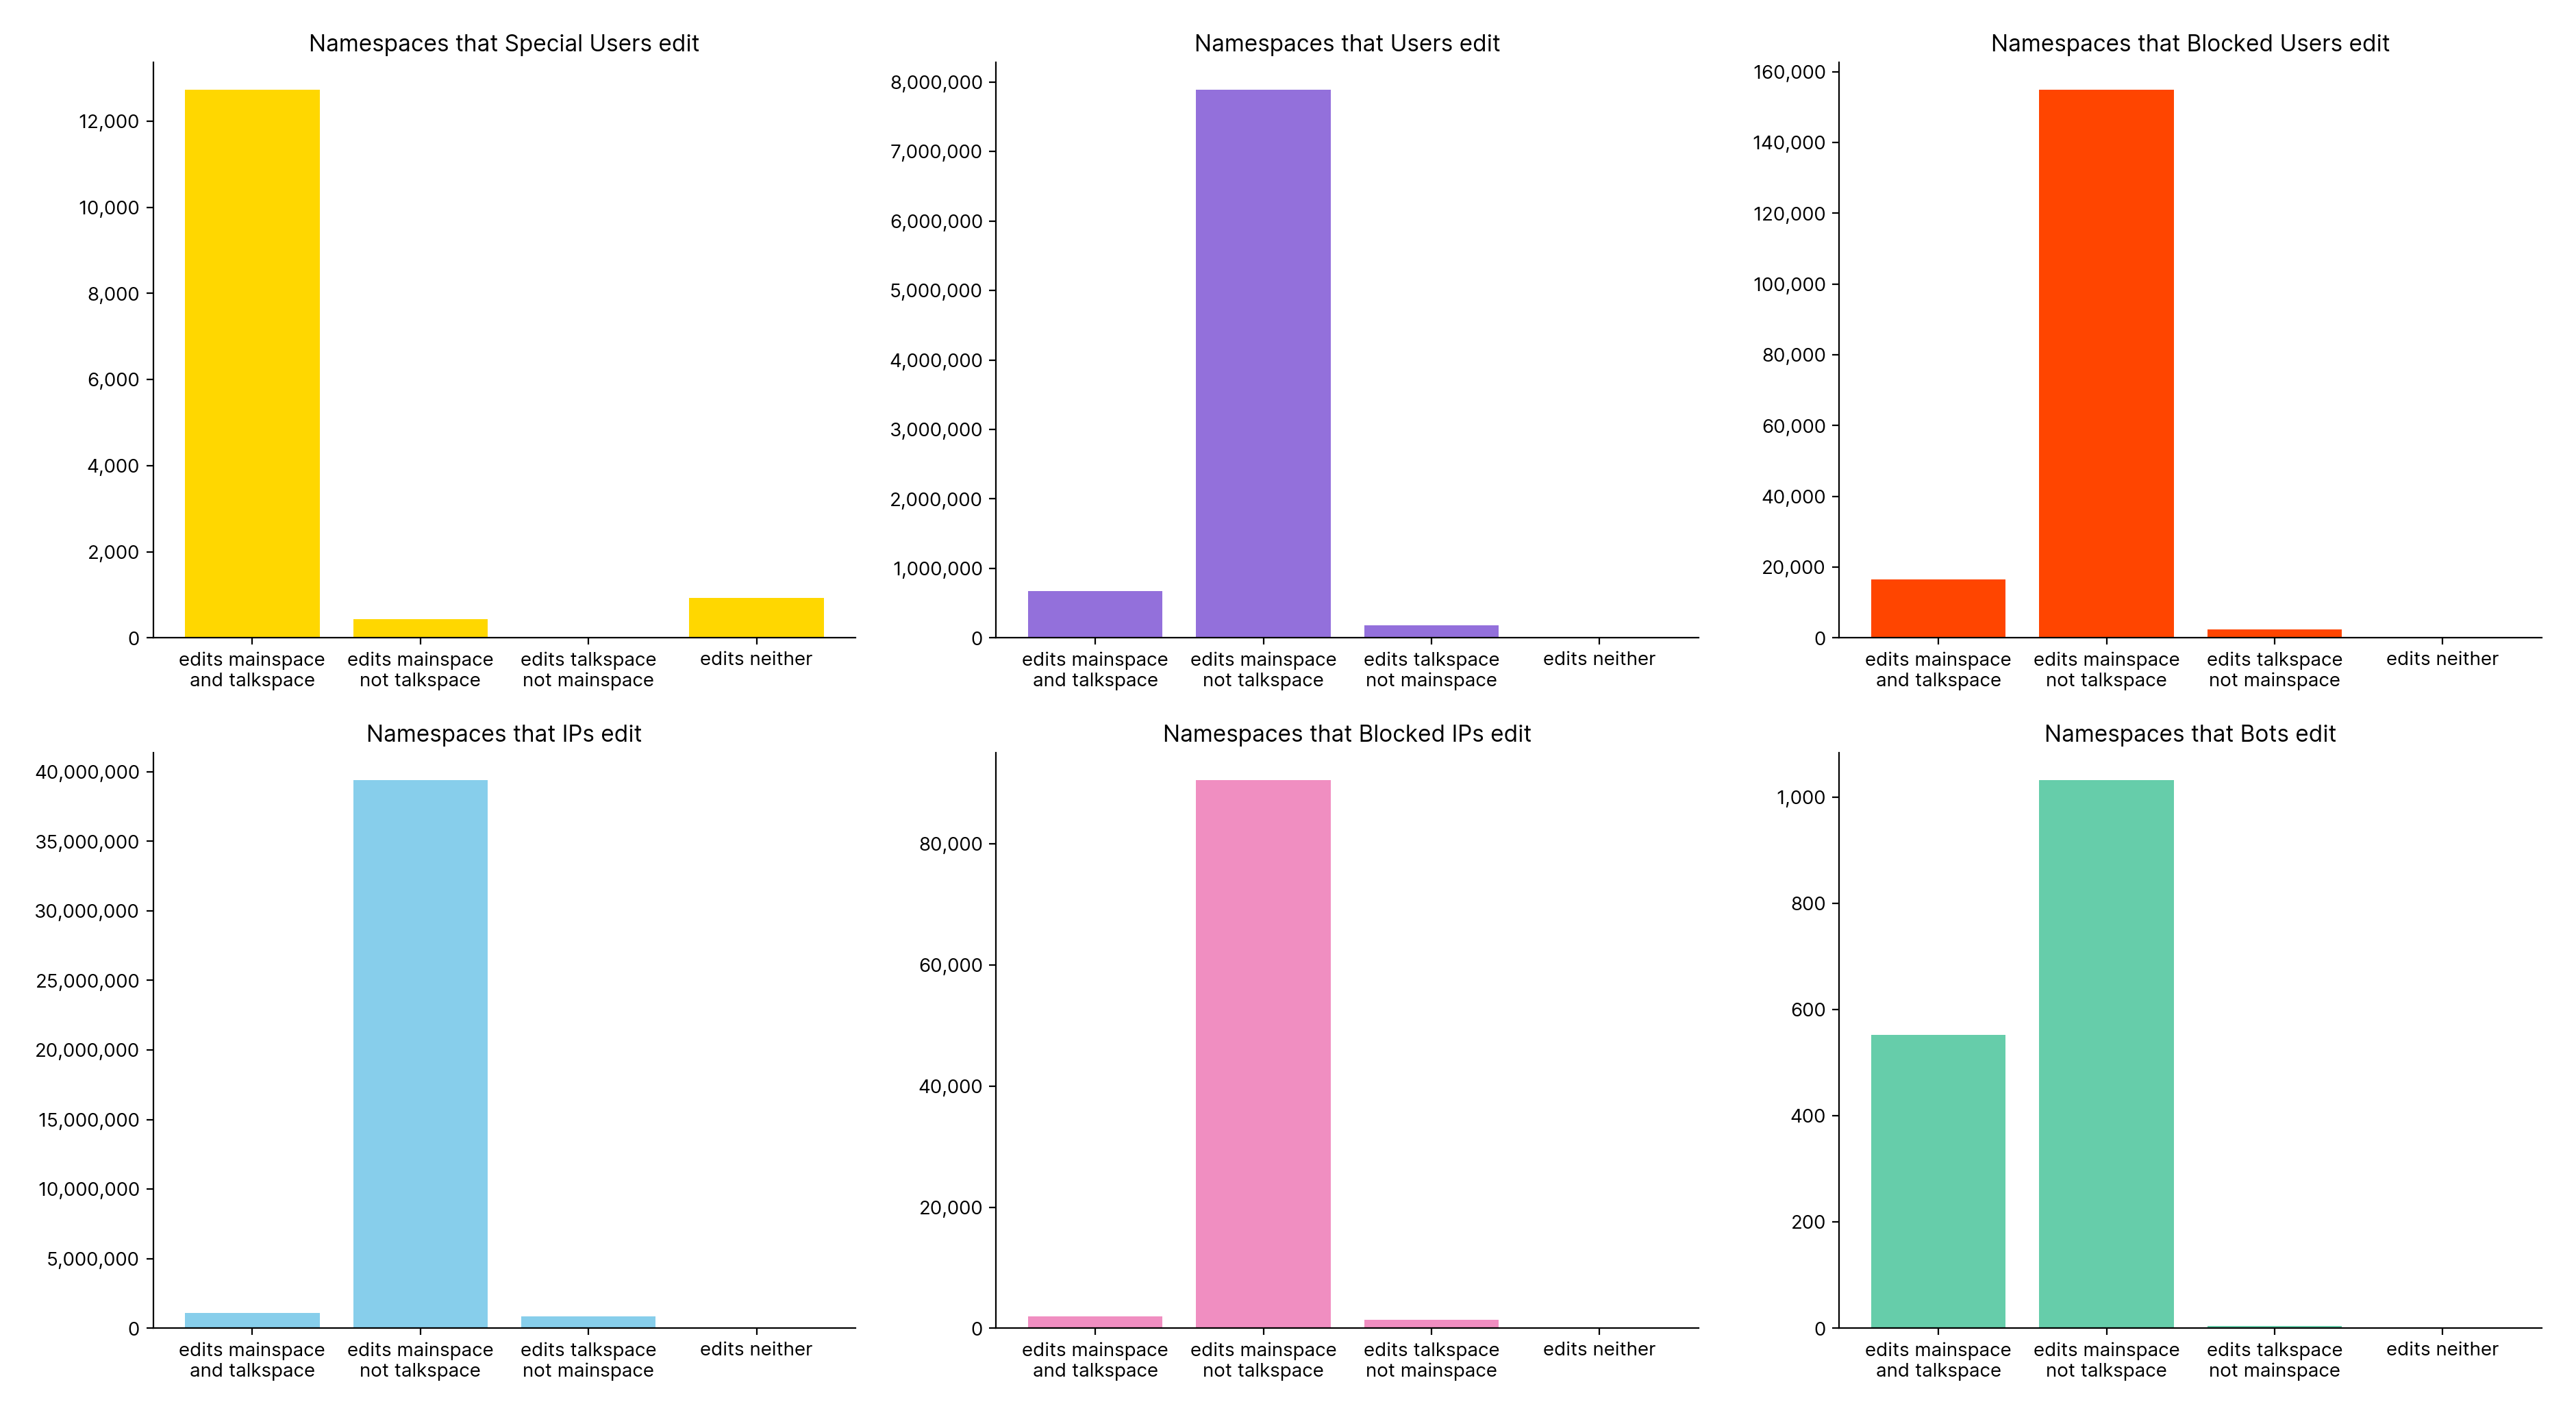
Figure 9
This is a break down of figure 4 for the different user groups. Blocked users proportionally edit both main and talk compared to the wider population of users in general.
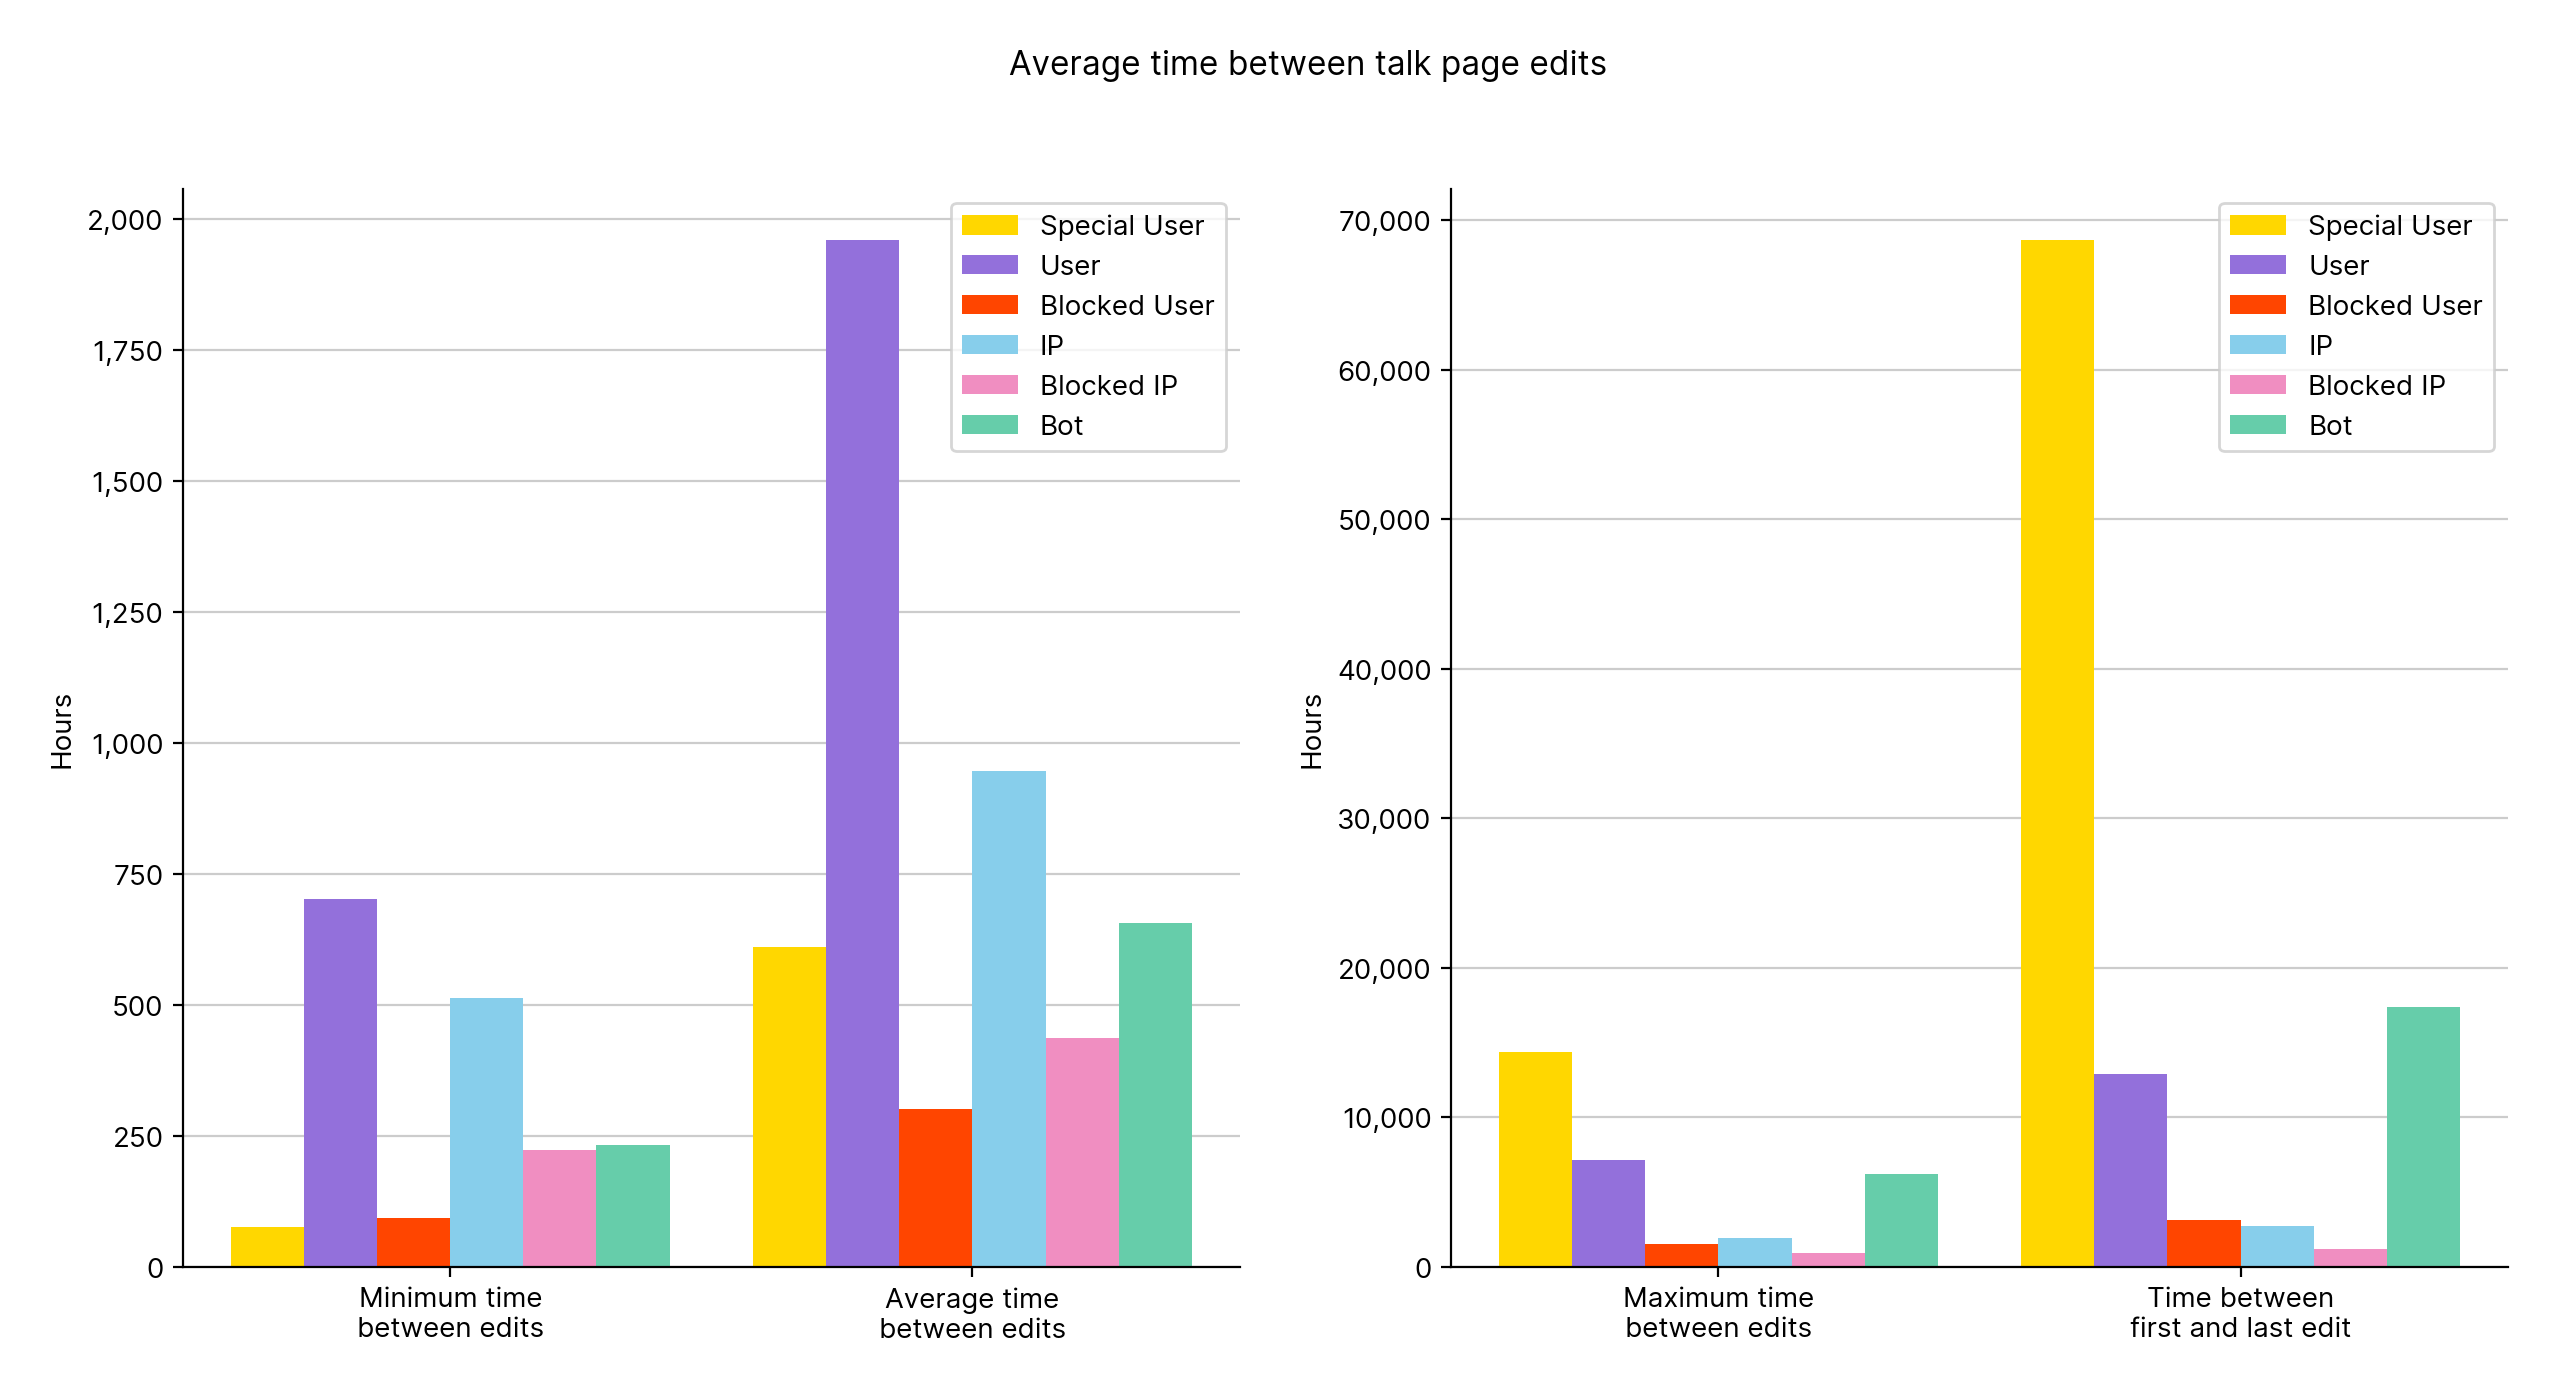
Figure 10.1
Users with special privileges have both the longest maximum time between edits and edit more frequently than users in general. Blocked users have shorter account durations which follows intution.
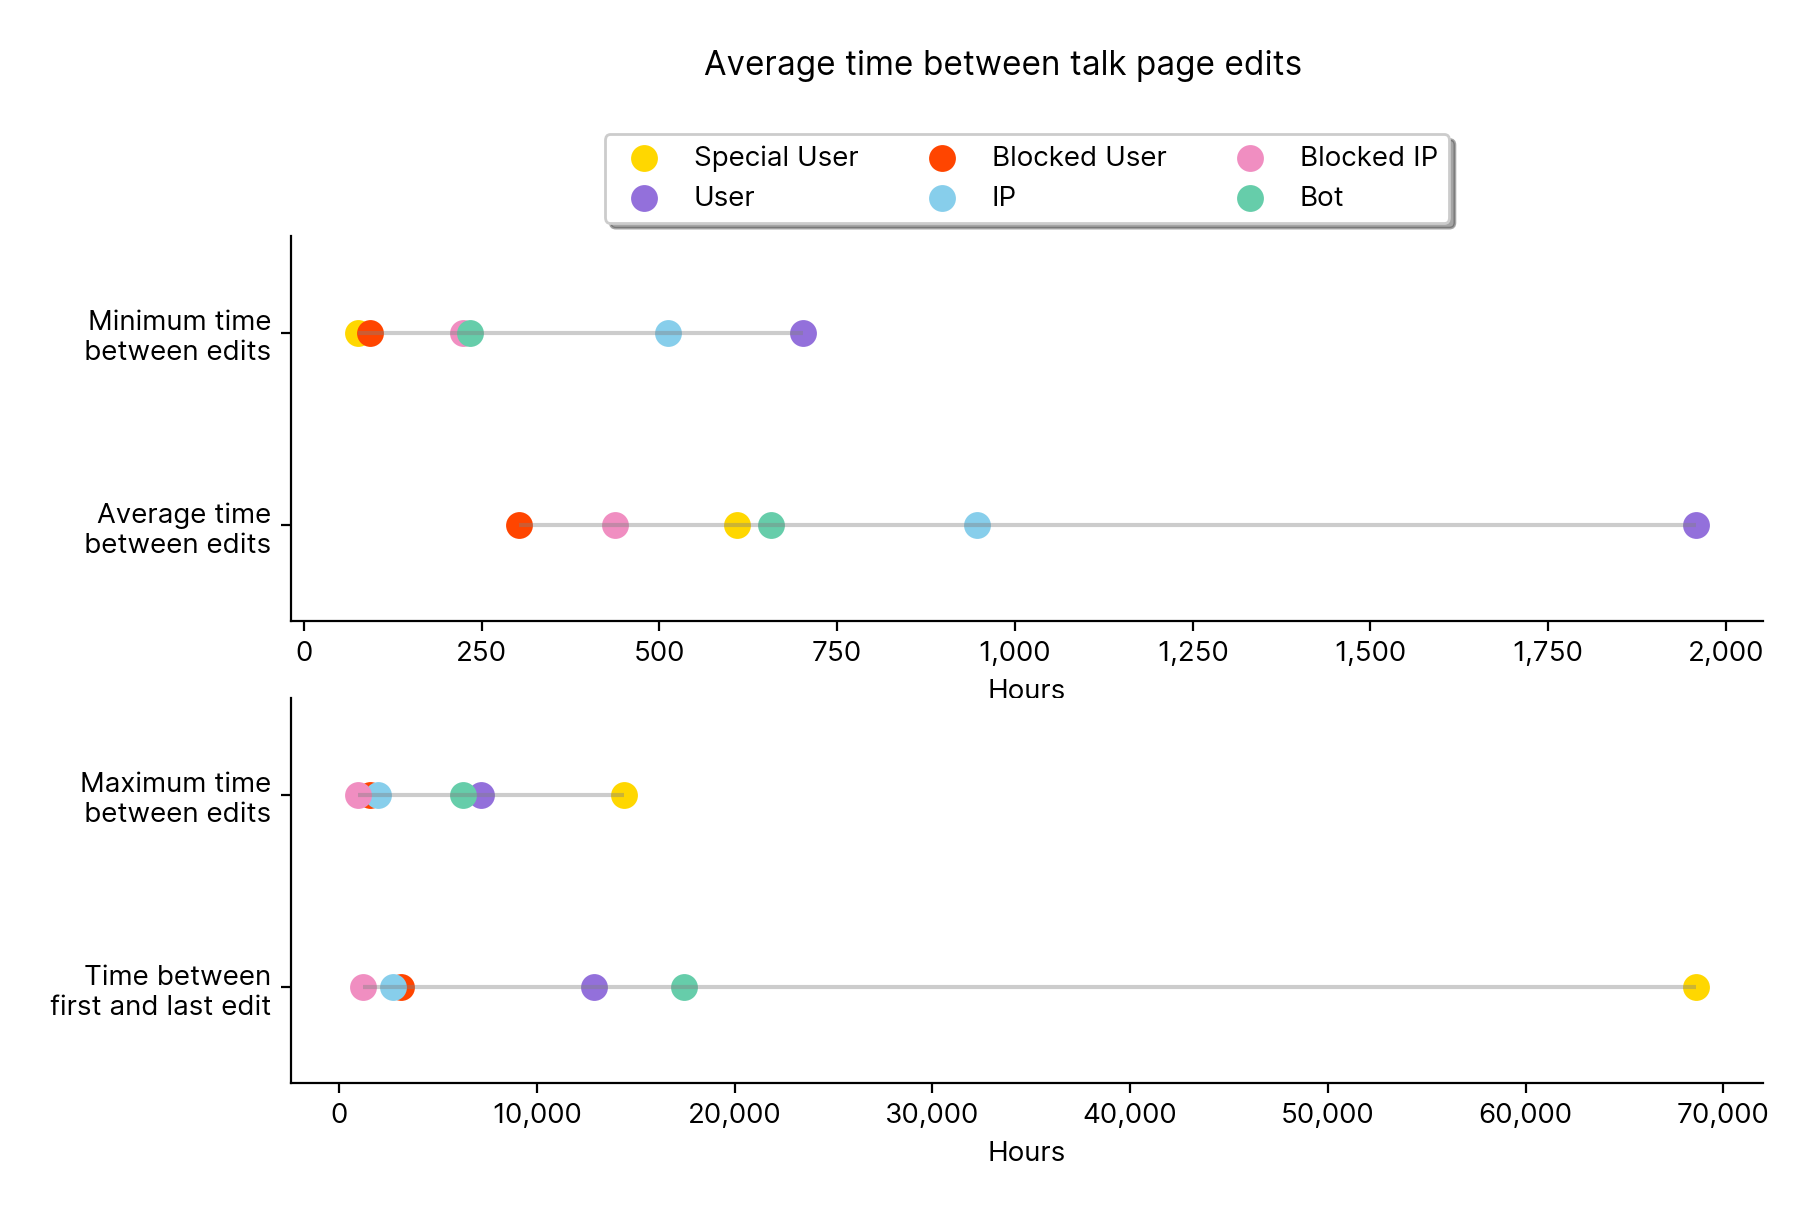
Figure 10.2
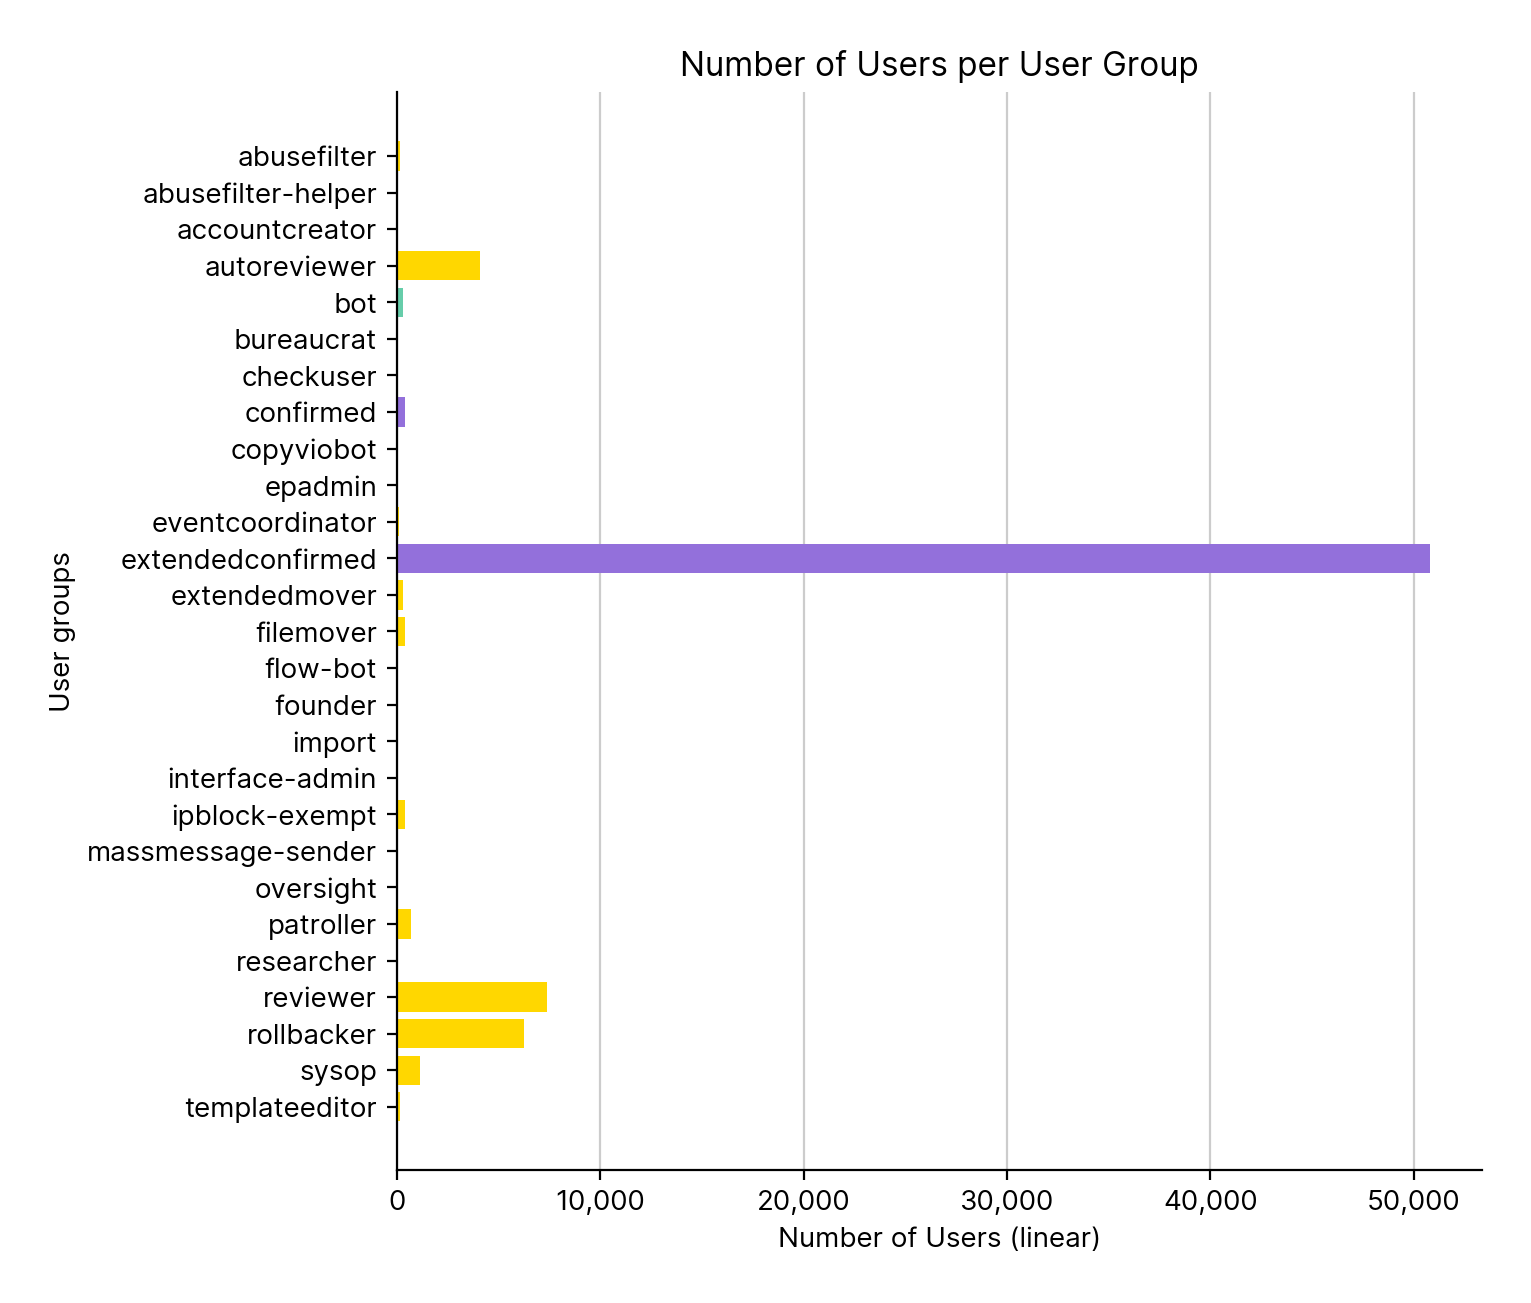
Figure 18.1 linear
Unlike the other plots, the data represented in this chart is directly from the dumps and no processing is needed. These are all of the user groups in wikipedia and all of them are positive and denote a privilege that the user can subsequently do. Extended confirmed is the largest group as all non-blocked accounts that reach 500 edits and are 30 days old become extended confirmed.
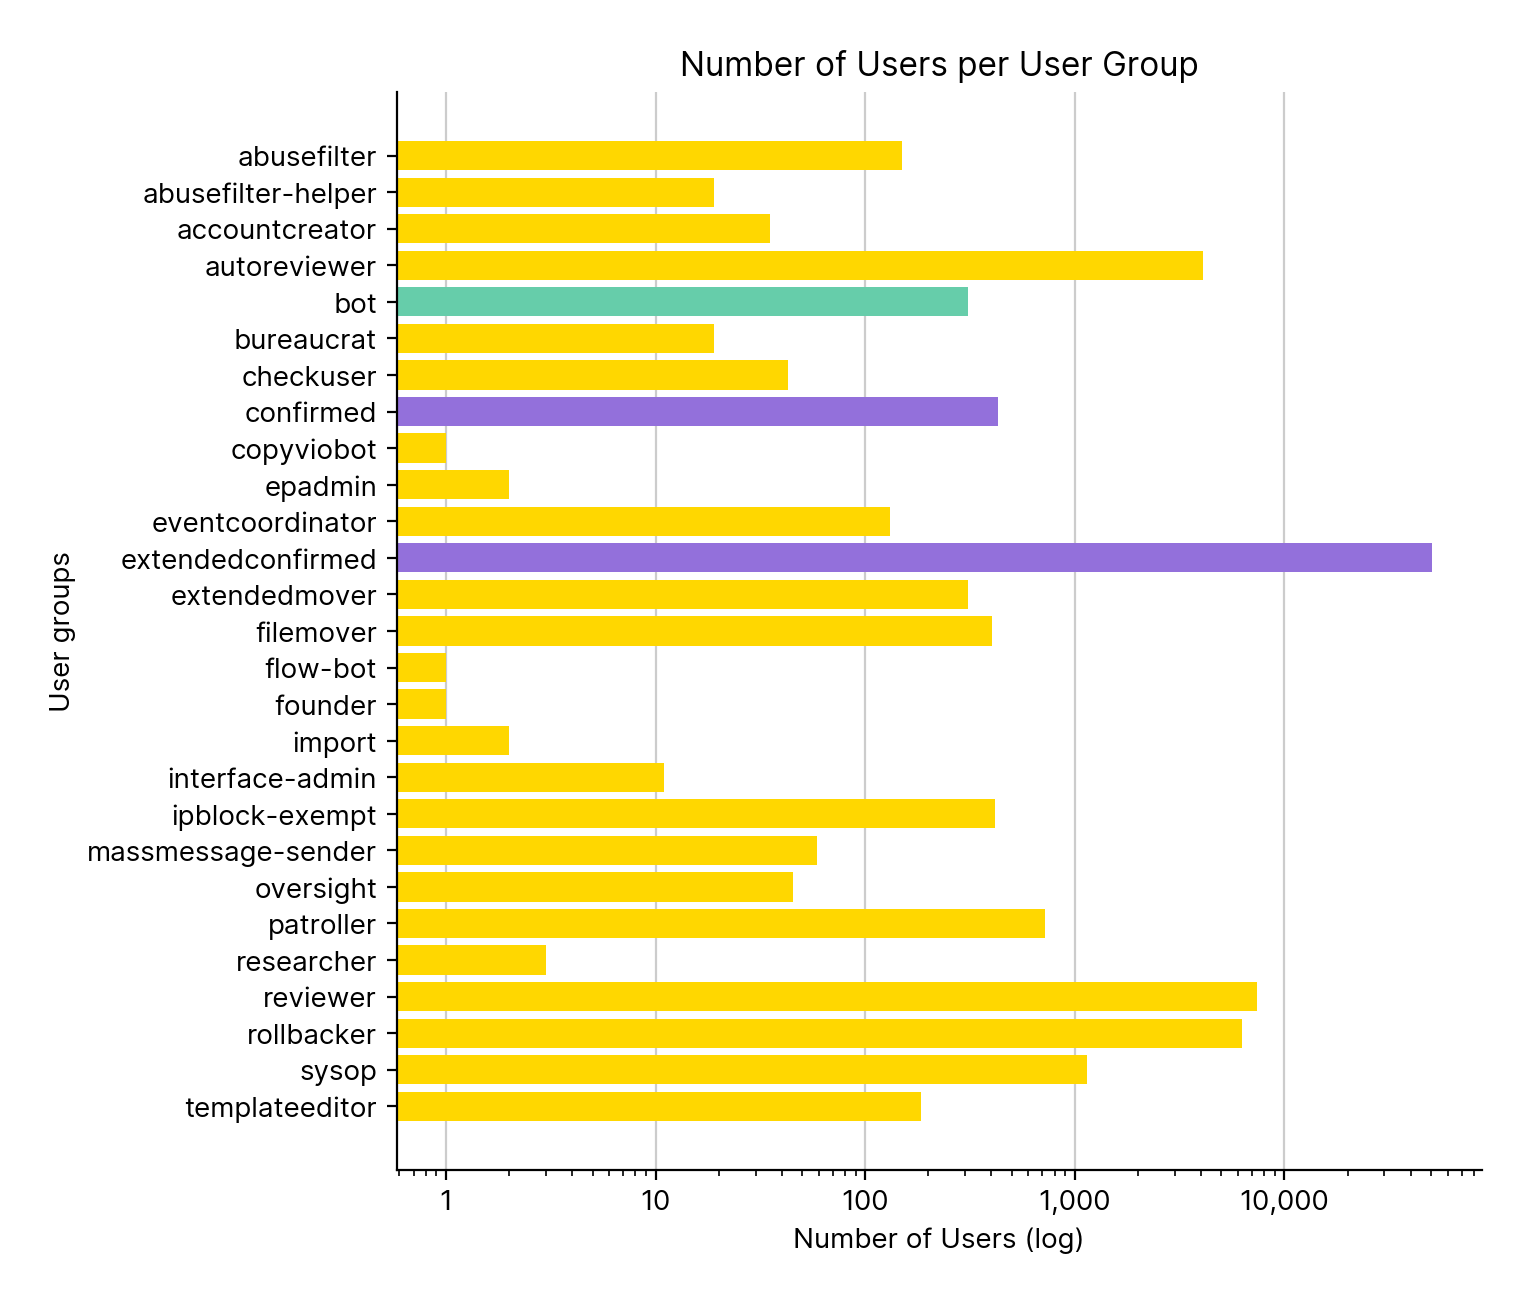
Figure 18.2 log
A log version of the previous plot. Details of the groups can be found User access levels page at Wikipedia.
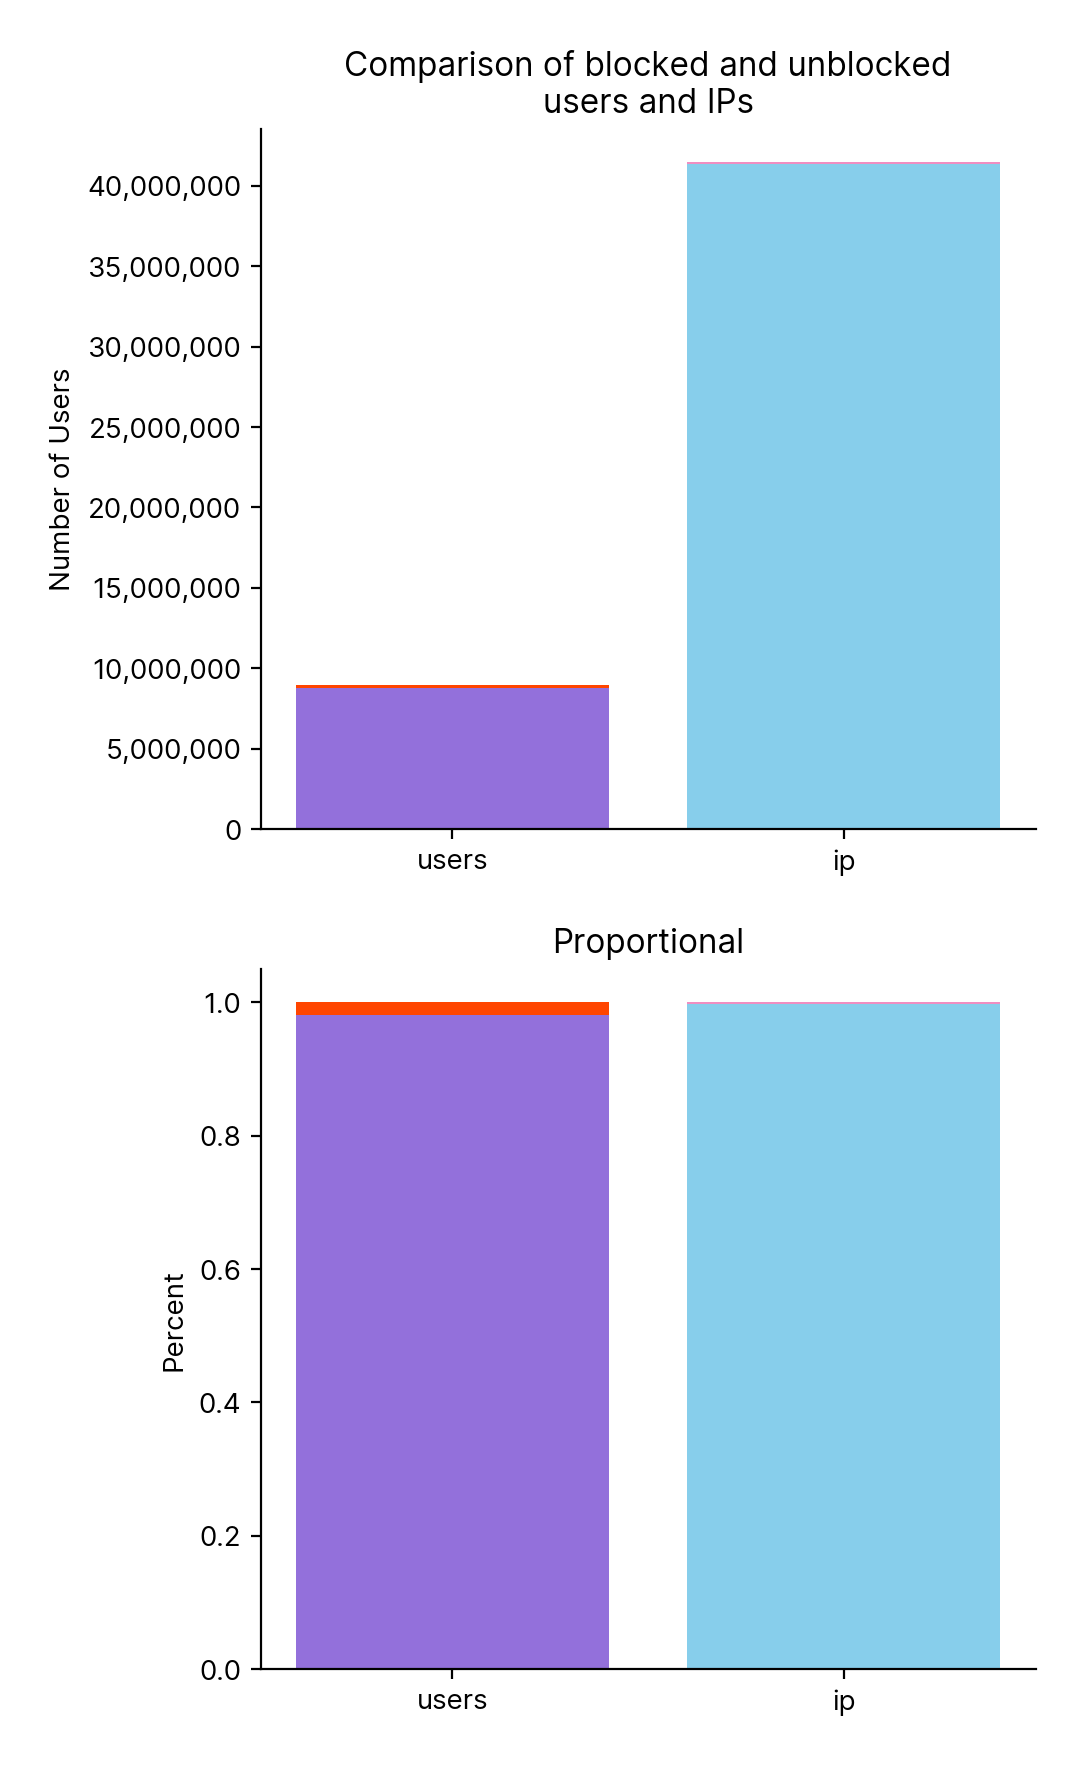
Figure 20
Only 93,851 IPs have been indefinitely blocked on Wikipedia, far less than the 41 million IPs that have ever made edits.
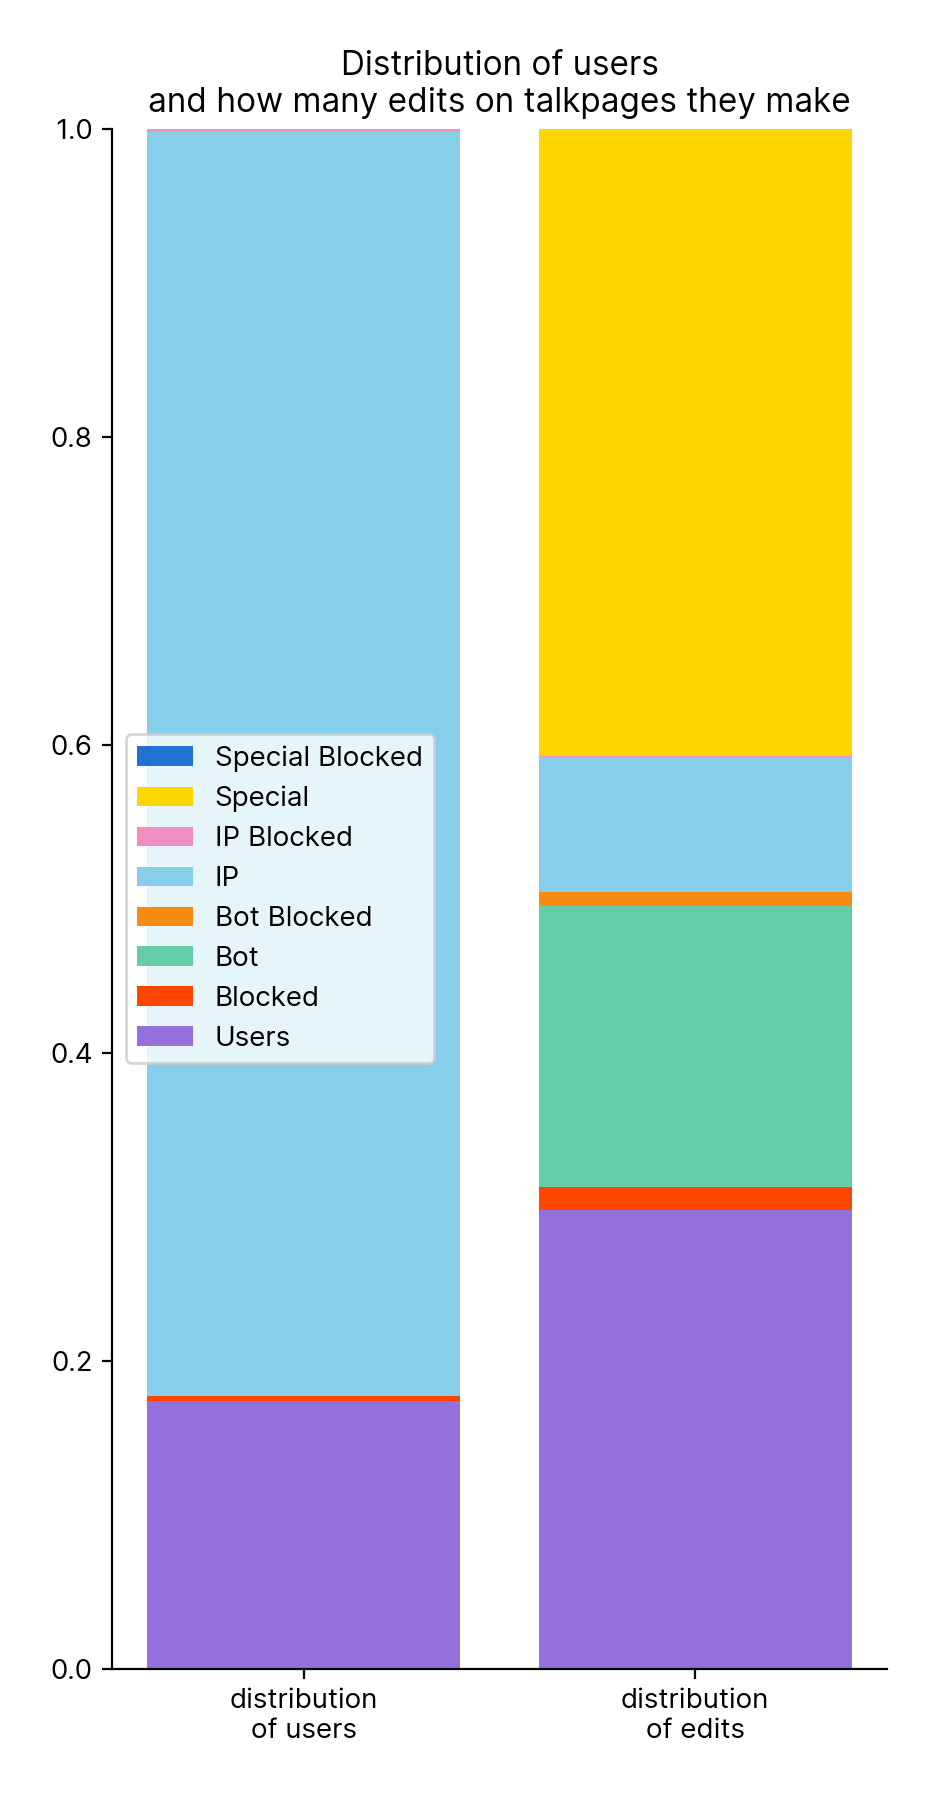
Figure 21
The 14,074 special users (excluding extended confirmed, confirmed and bots) make 42% of talkpage edits. IP users have the greatest reduction making up only 9% of talkpage edits.
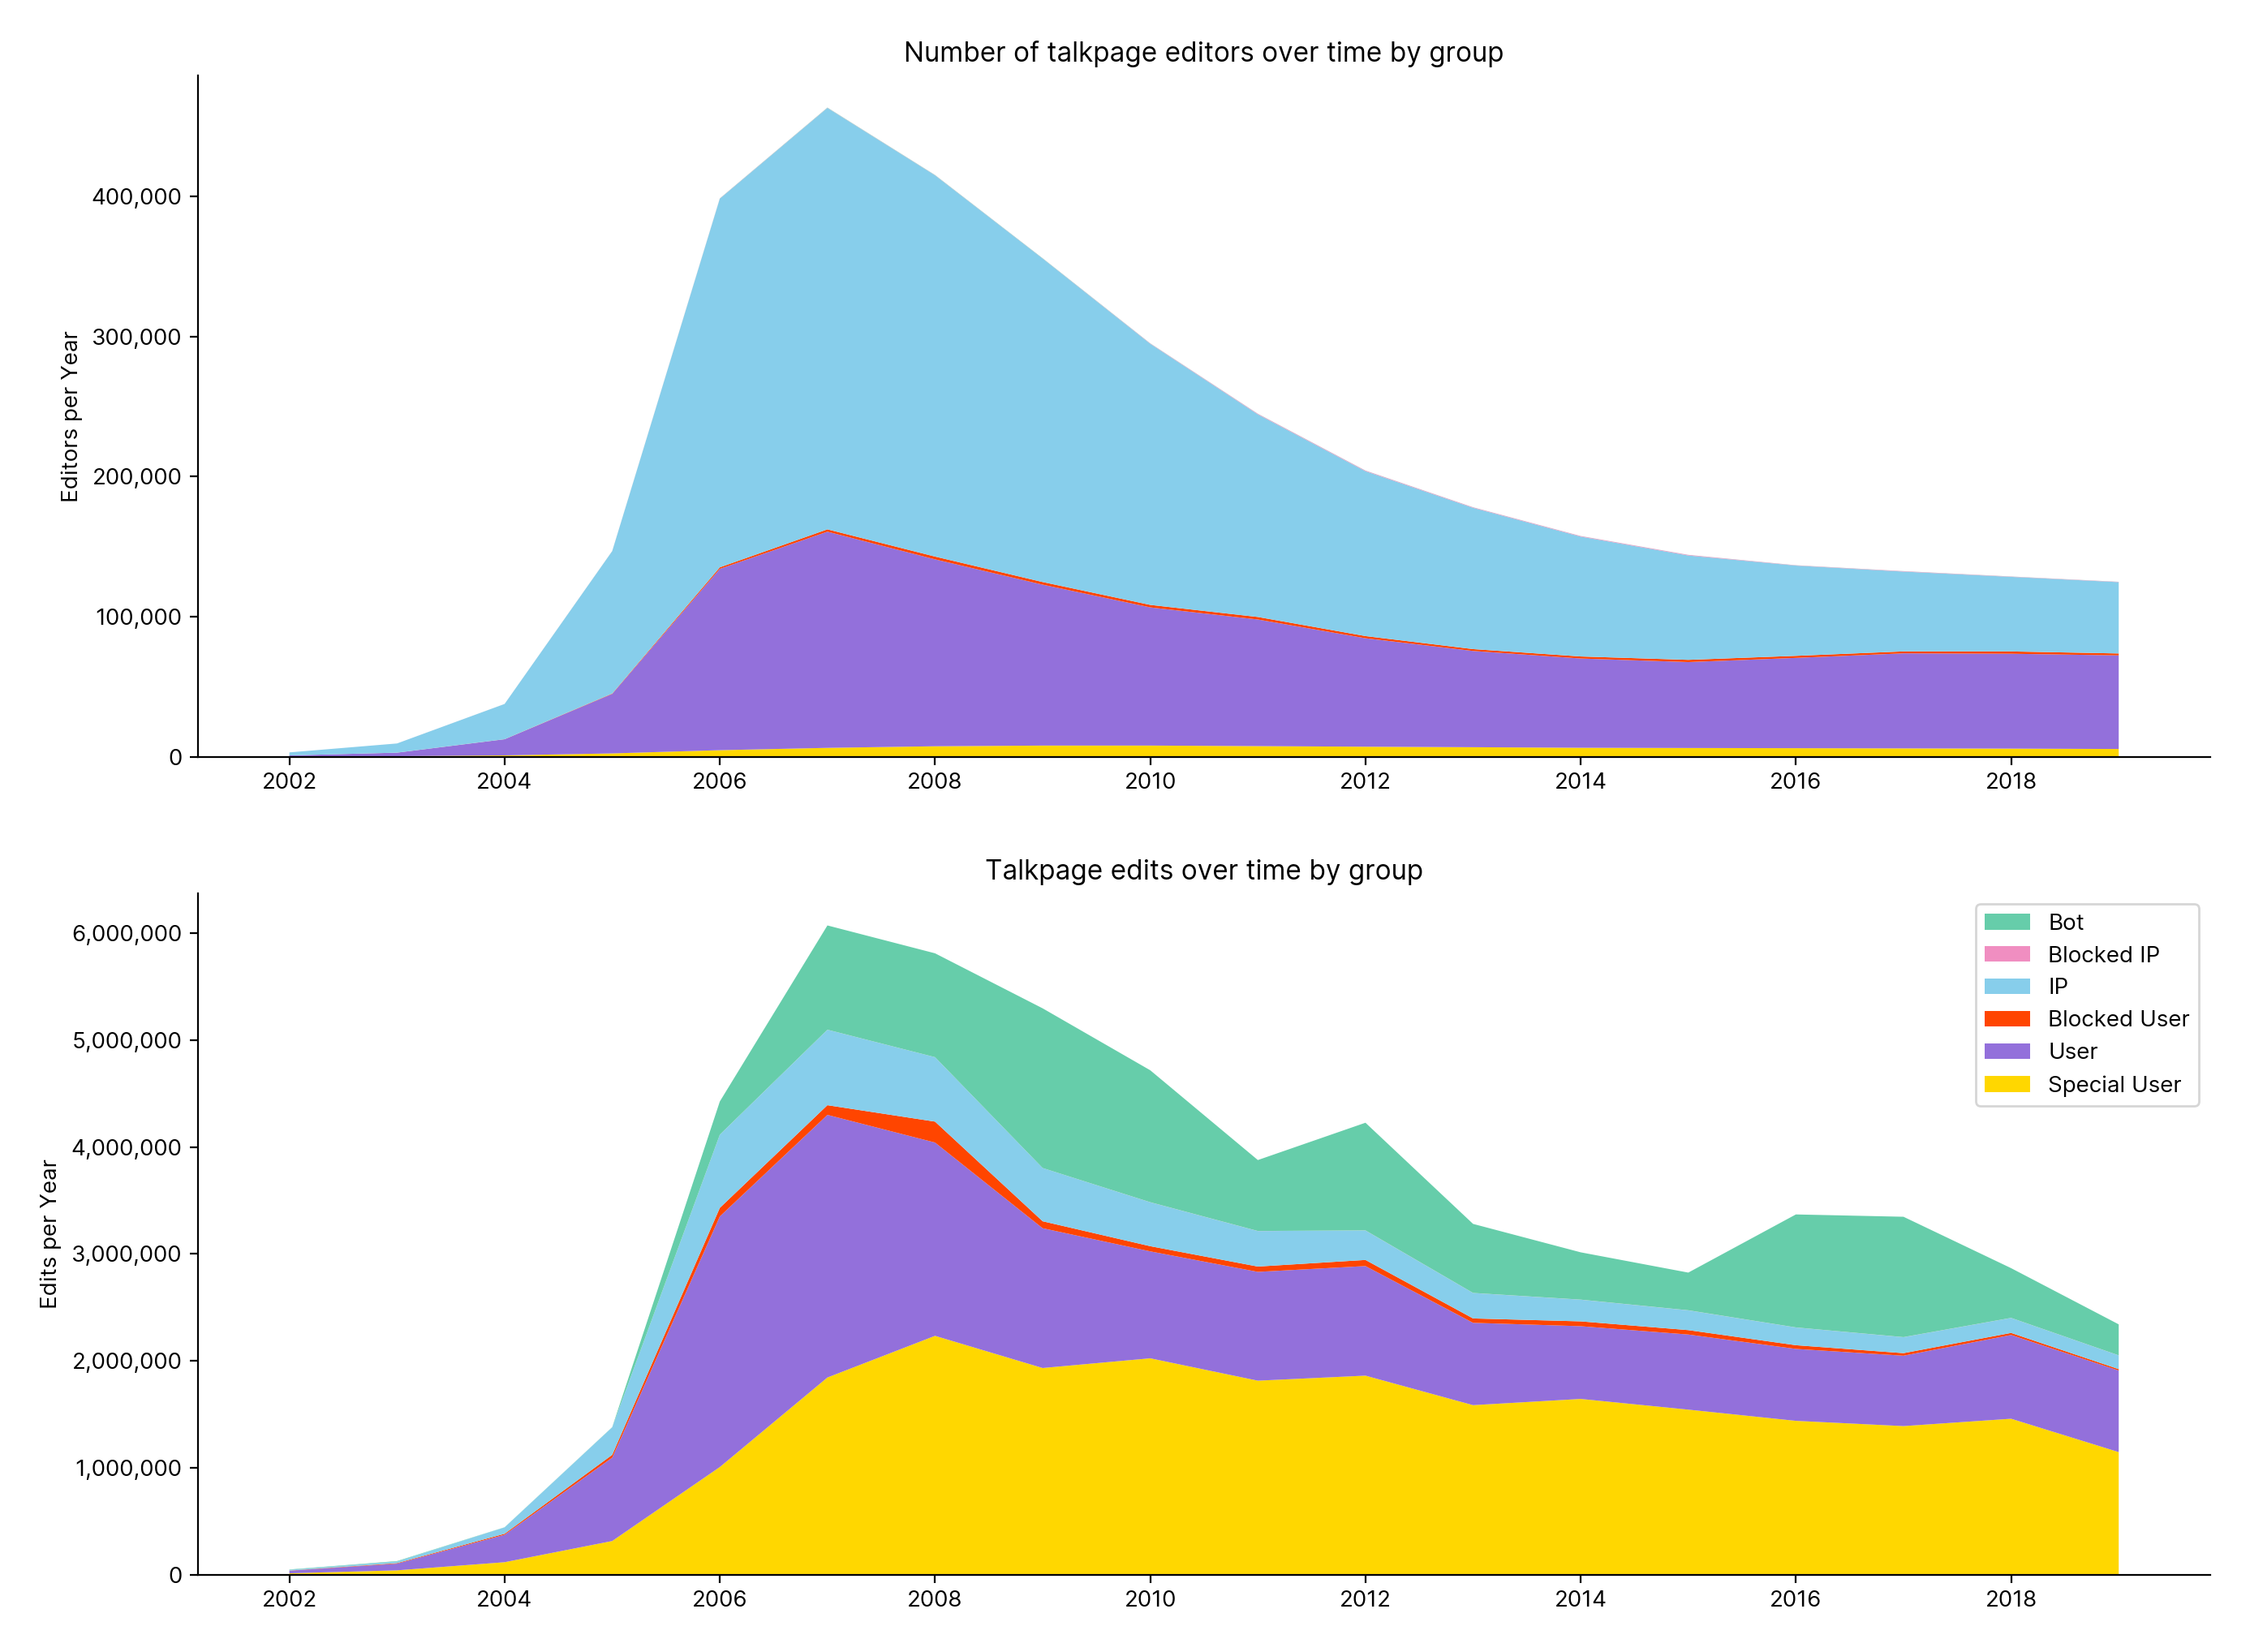
Figure 37.1
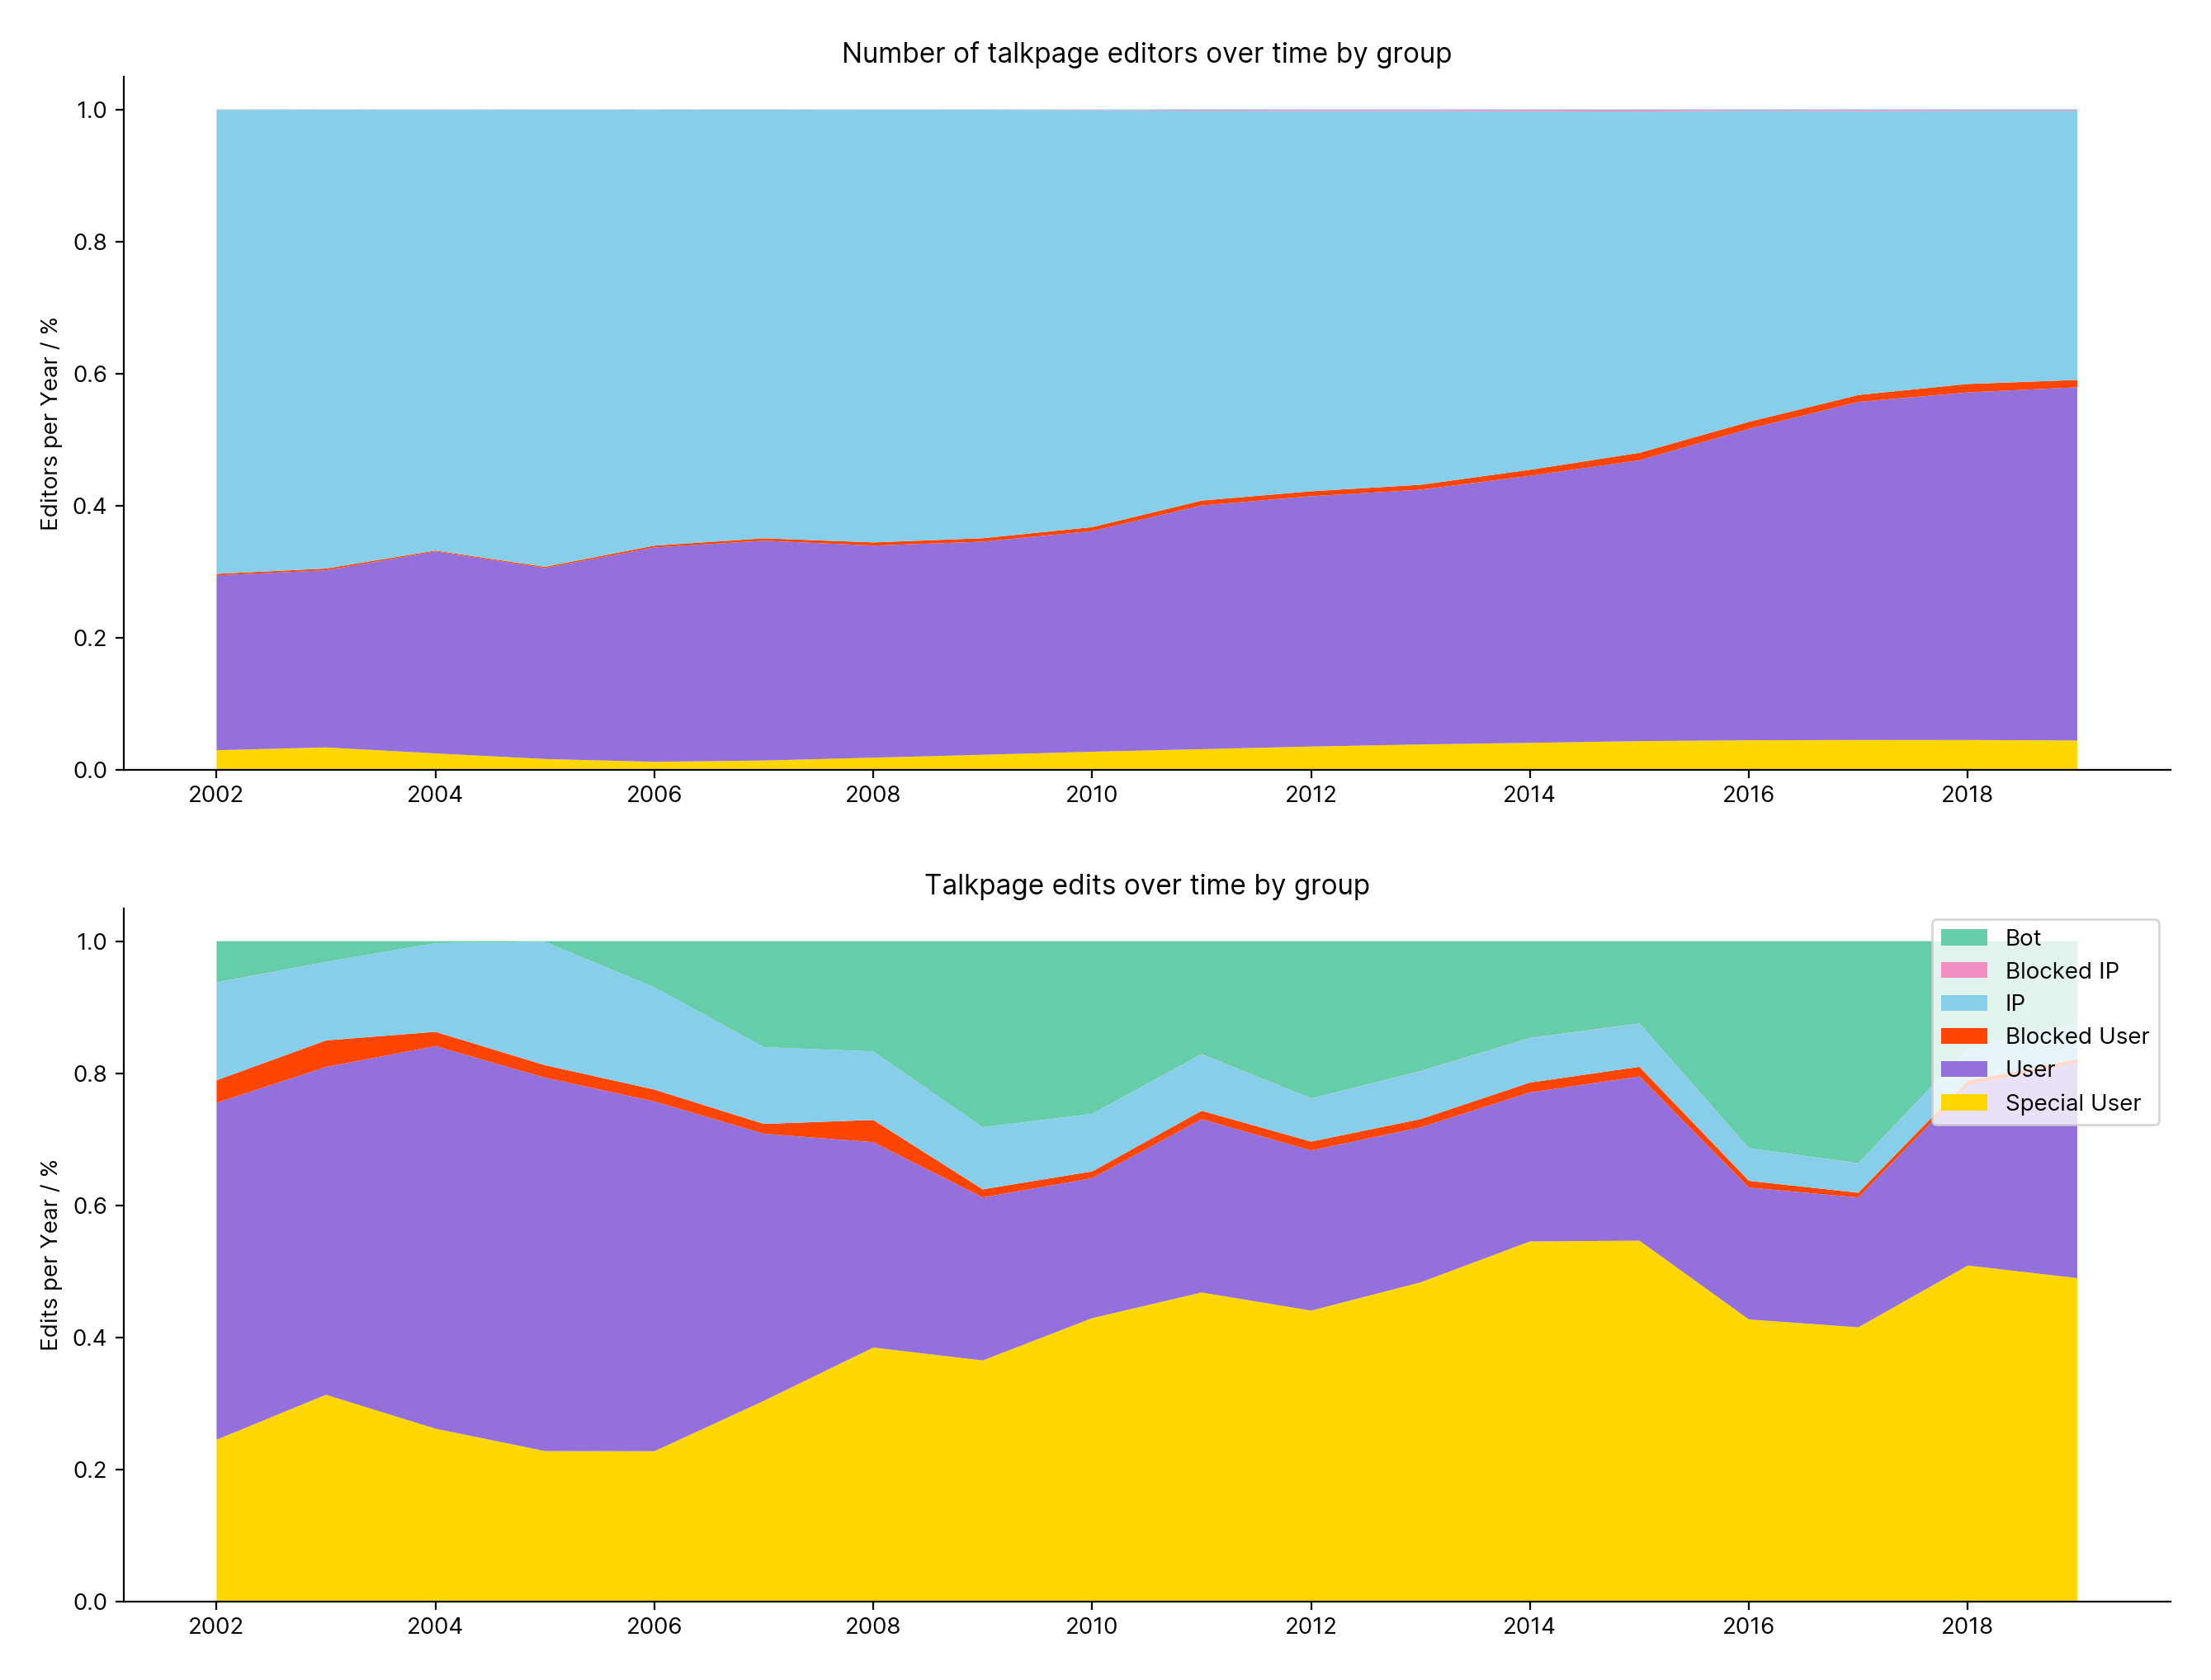
Figure 37.2
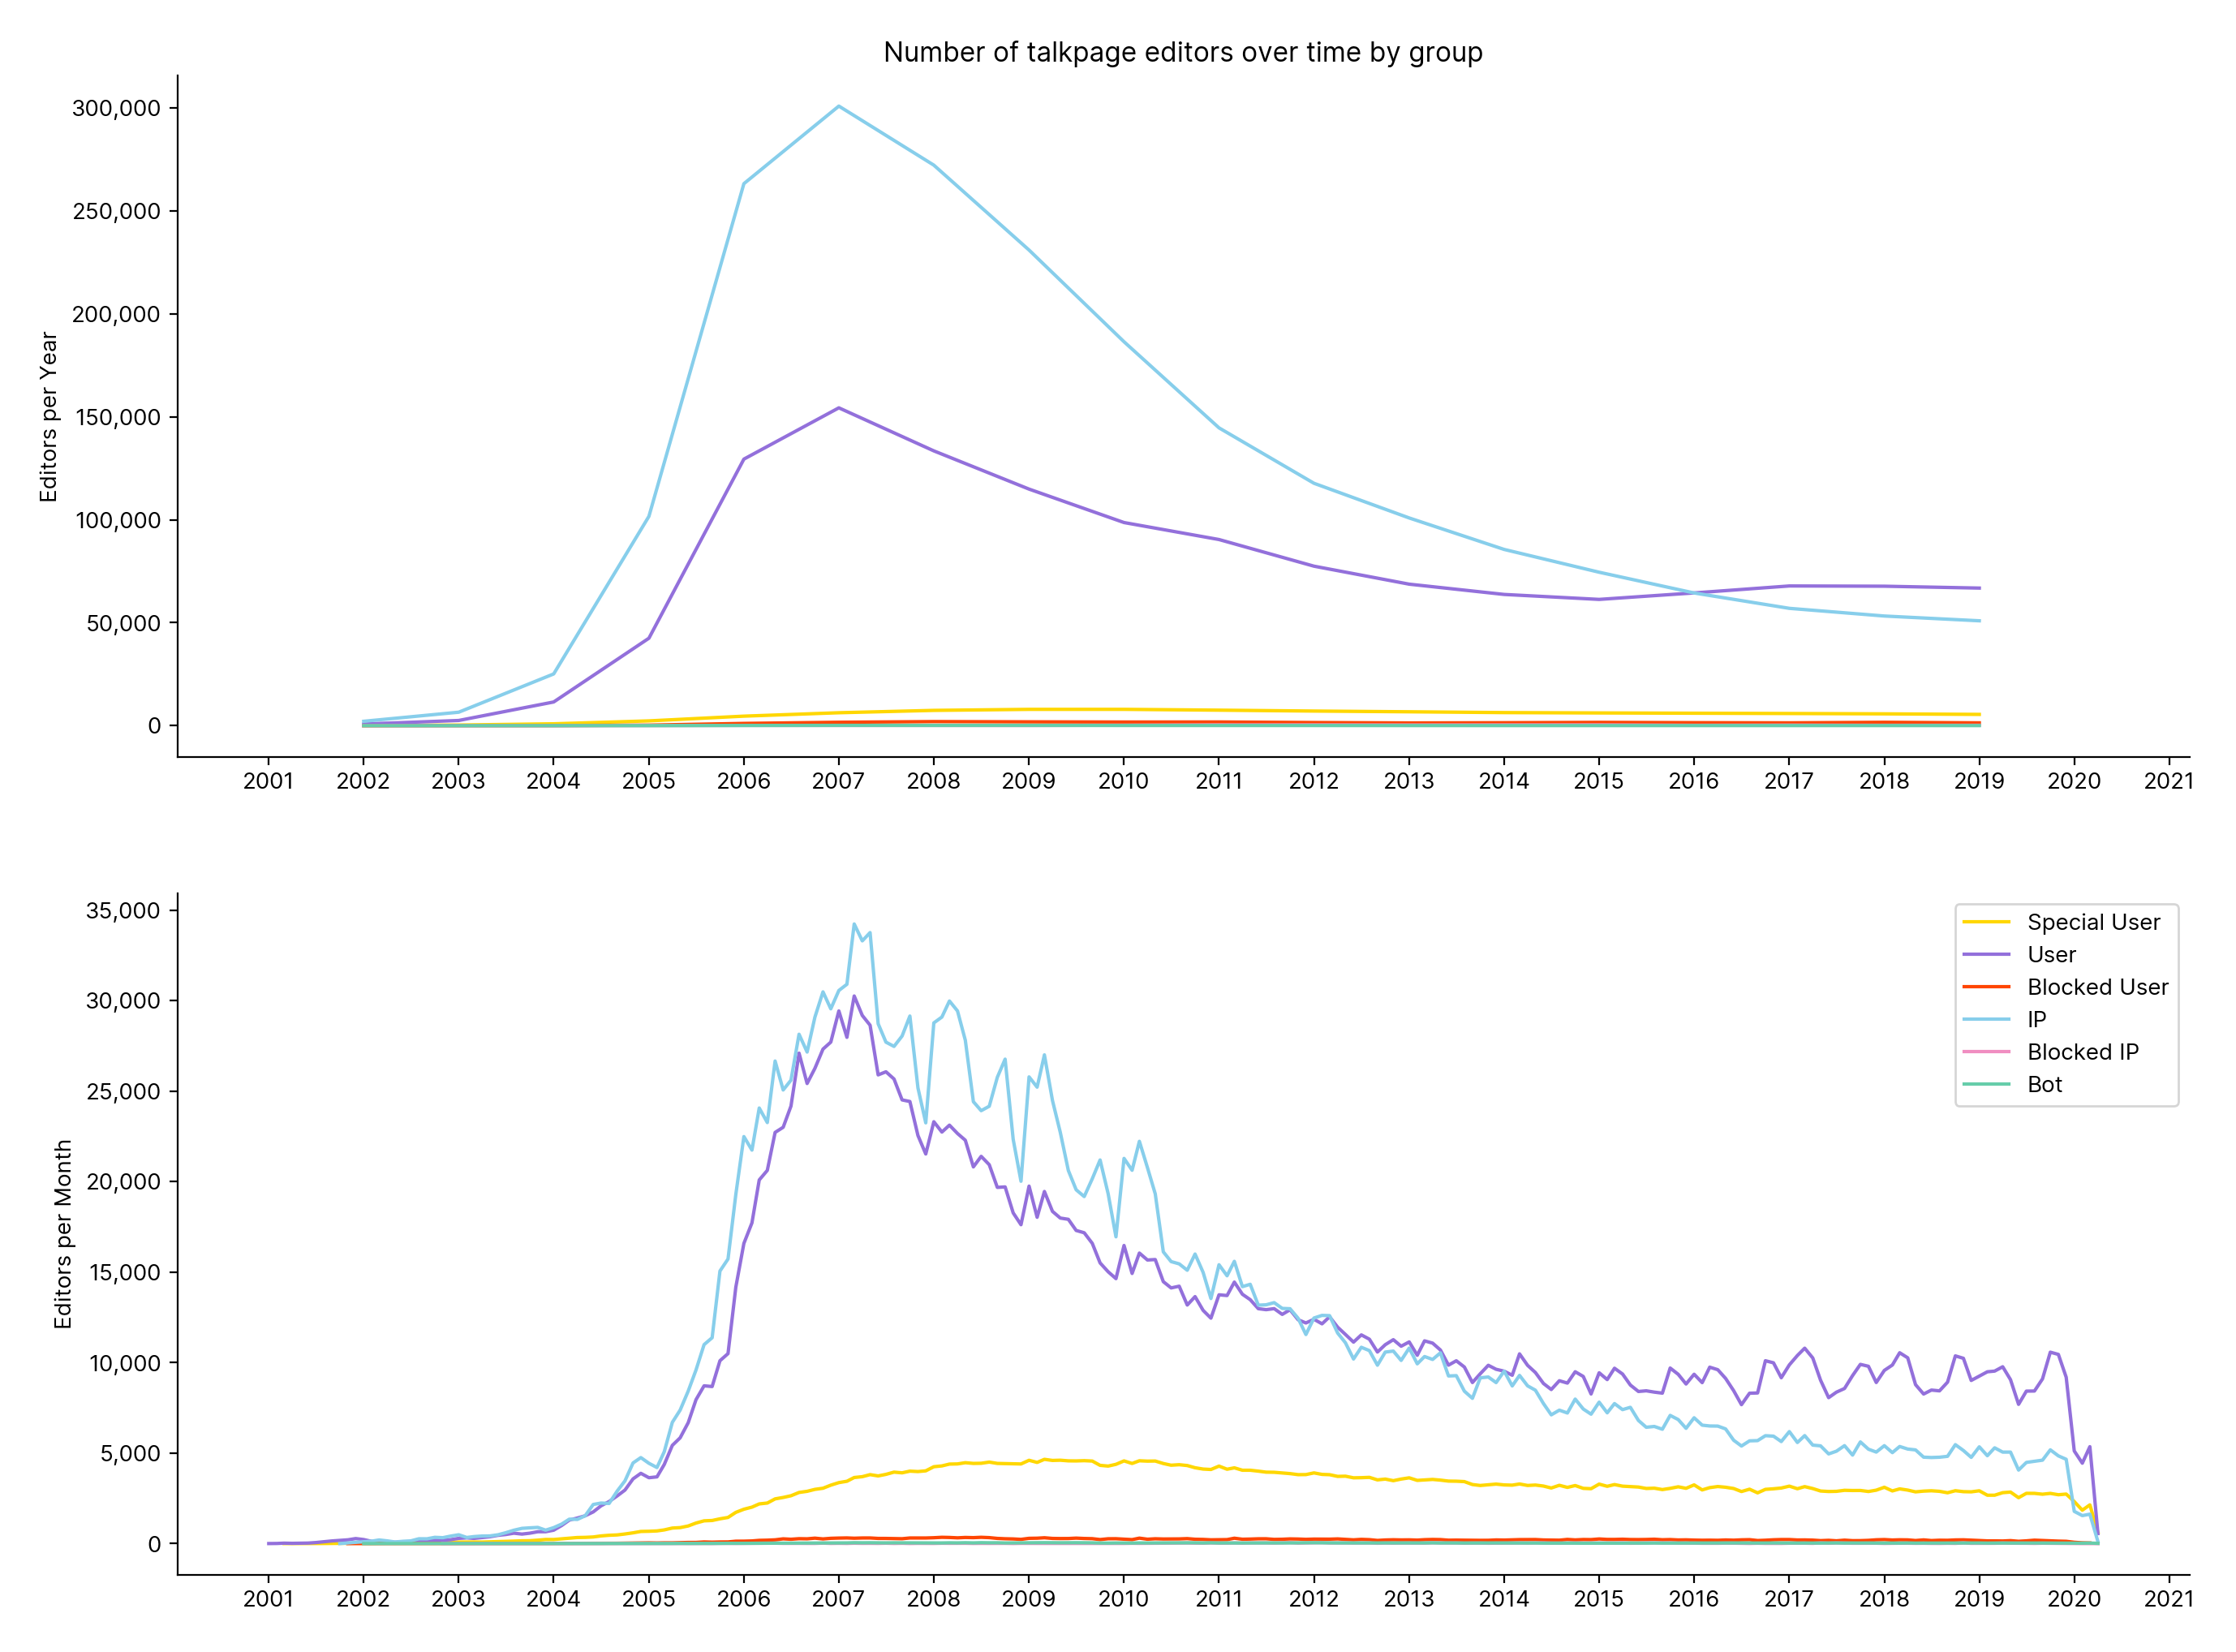
Figure 36
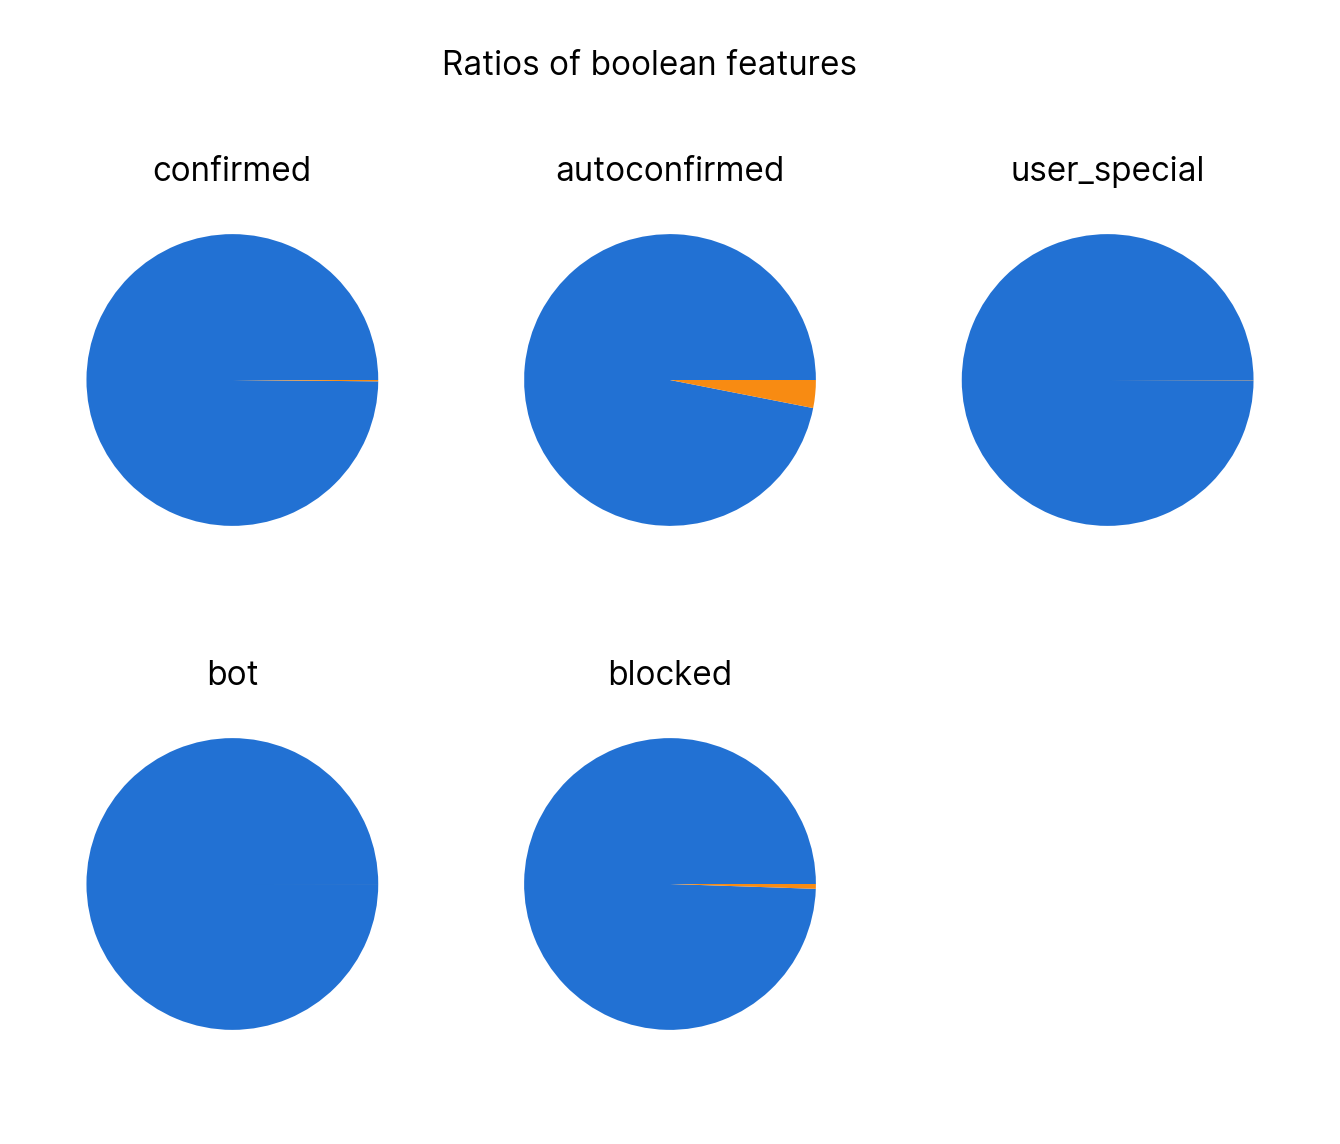
Figure 24
This shows the proportion of users that have a specific boolean feature. Autoconfirmed is the largest as all users with over 5 edits are autoconfirmed, showing the overwhelming majority of users make less than that many edits.
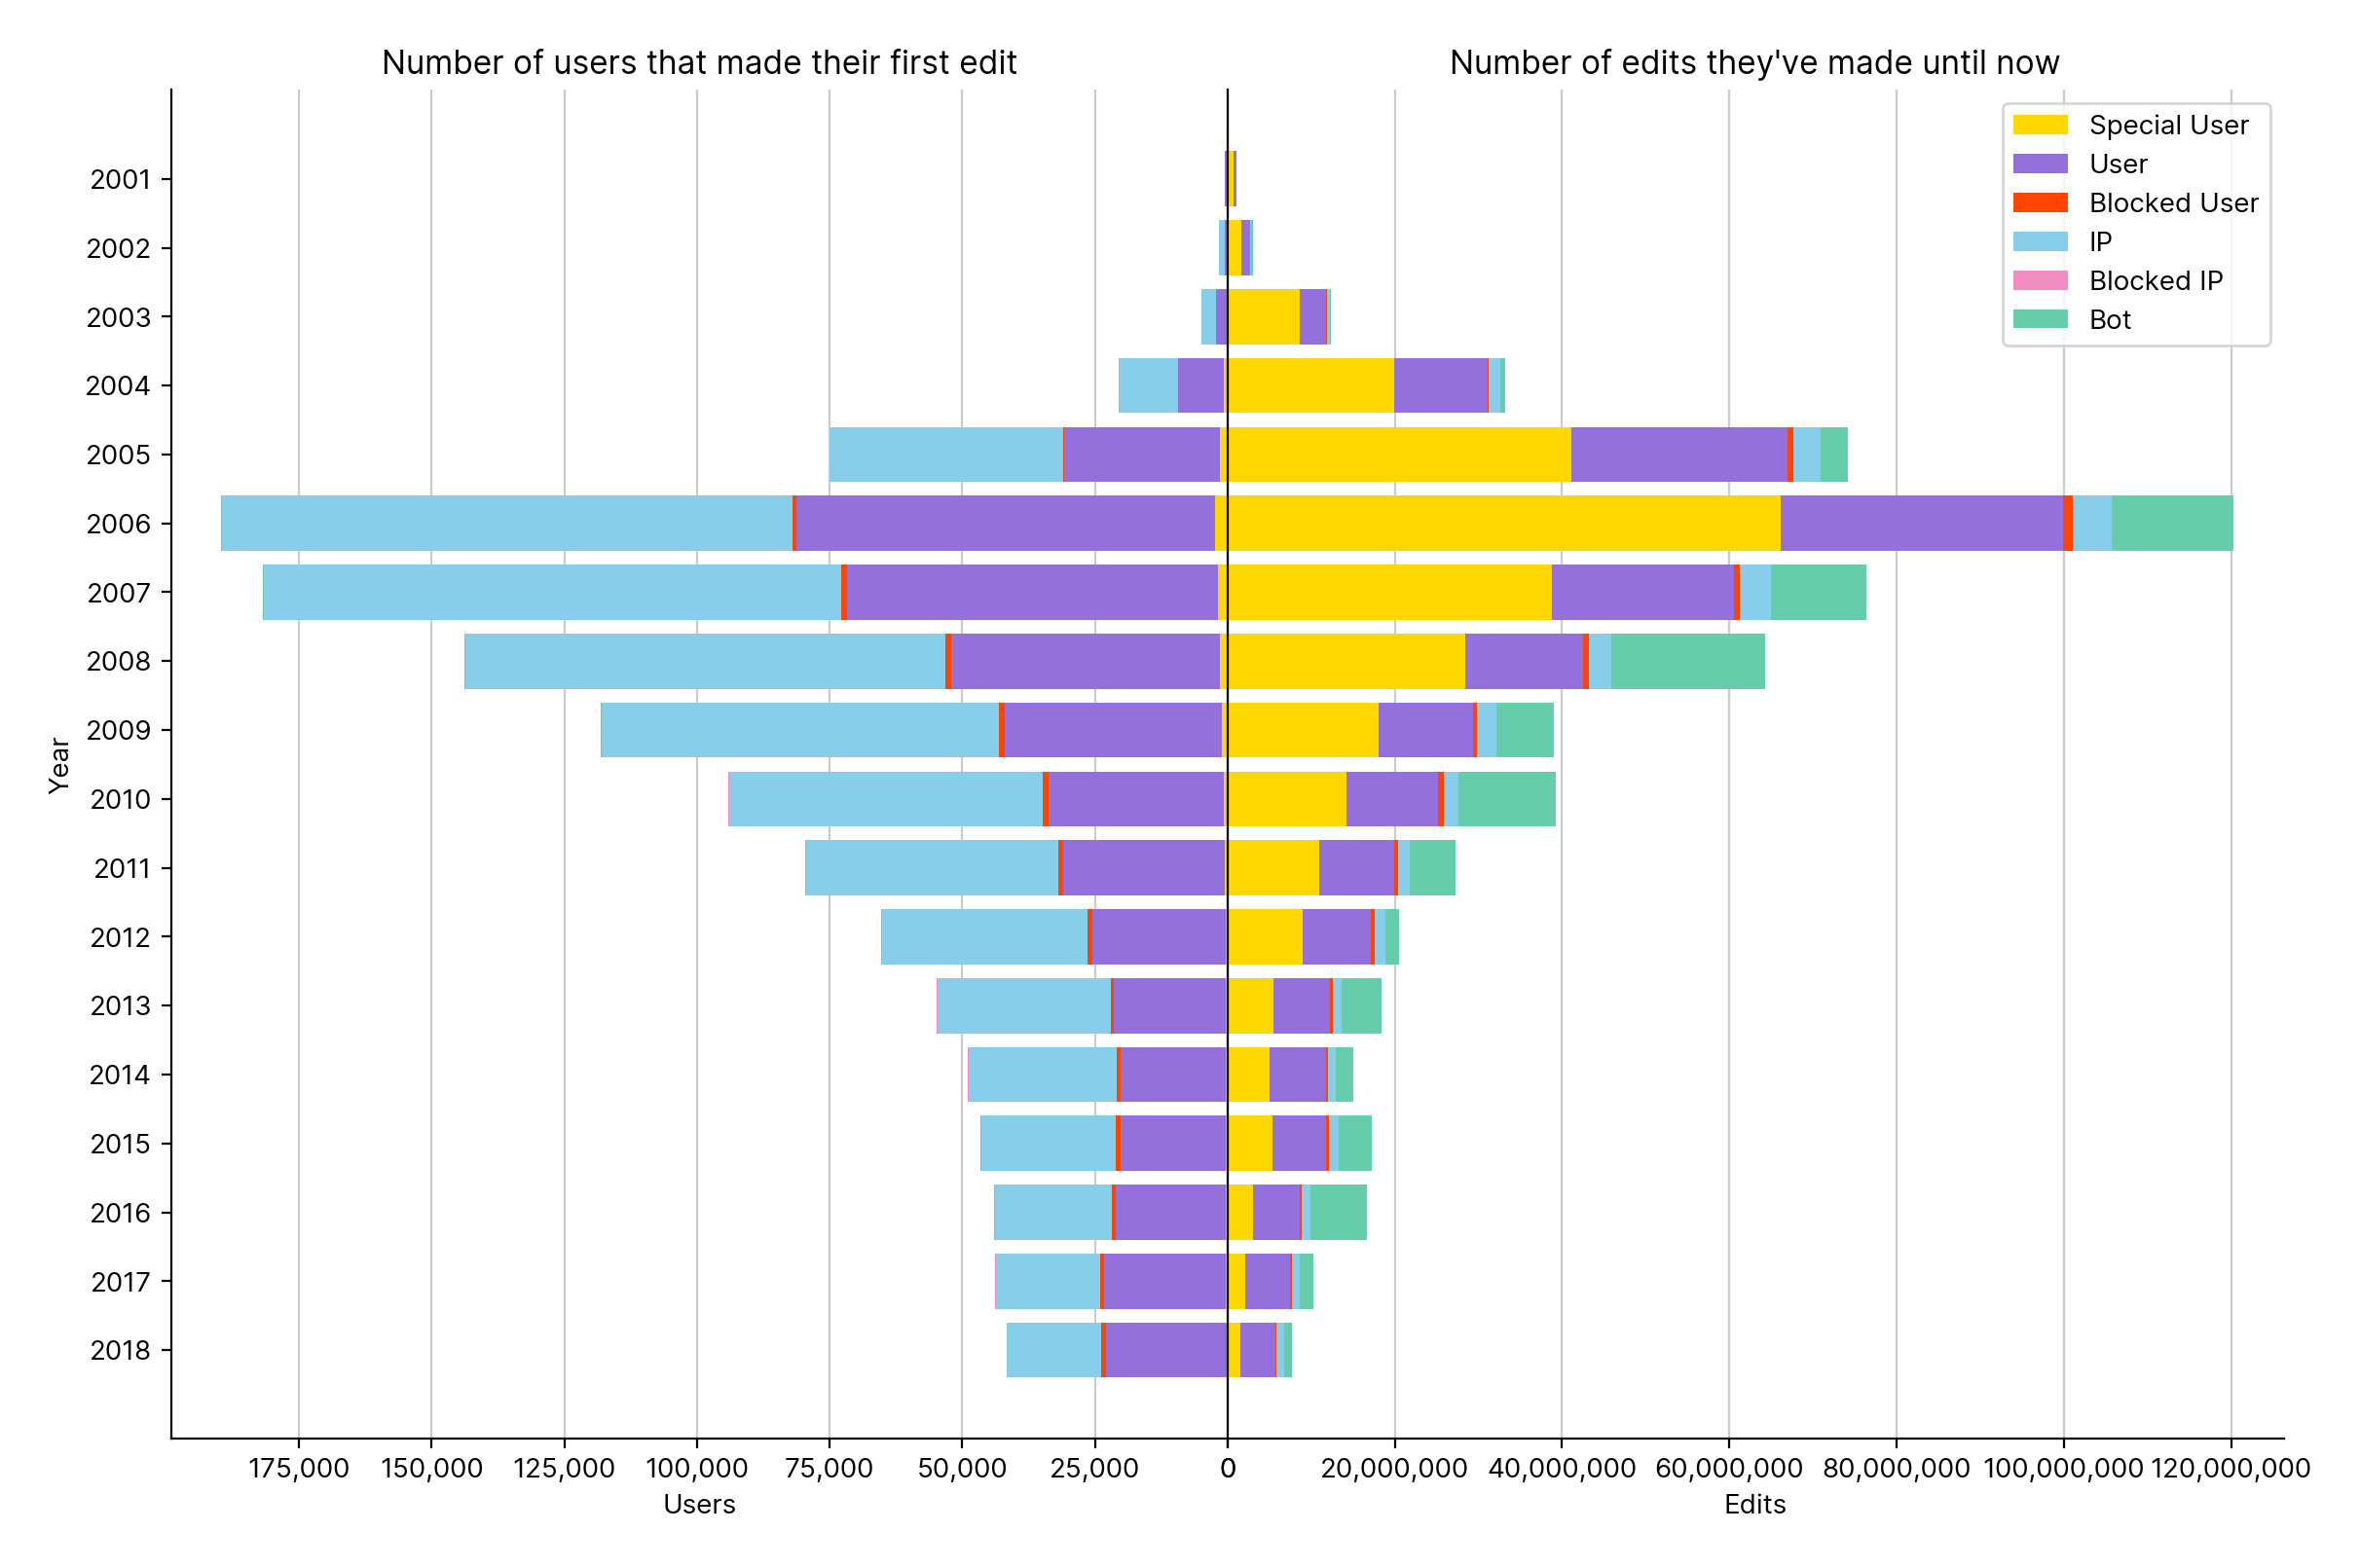
Figure 7.1
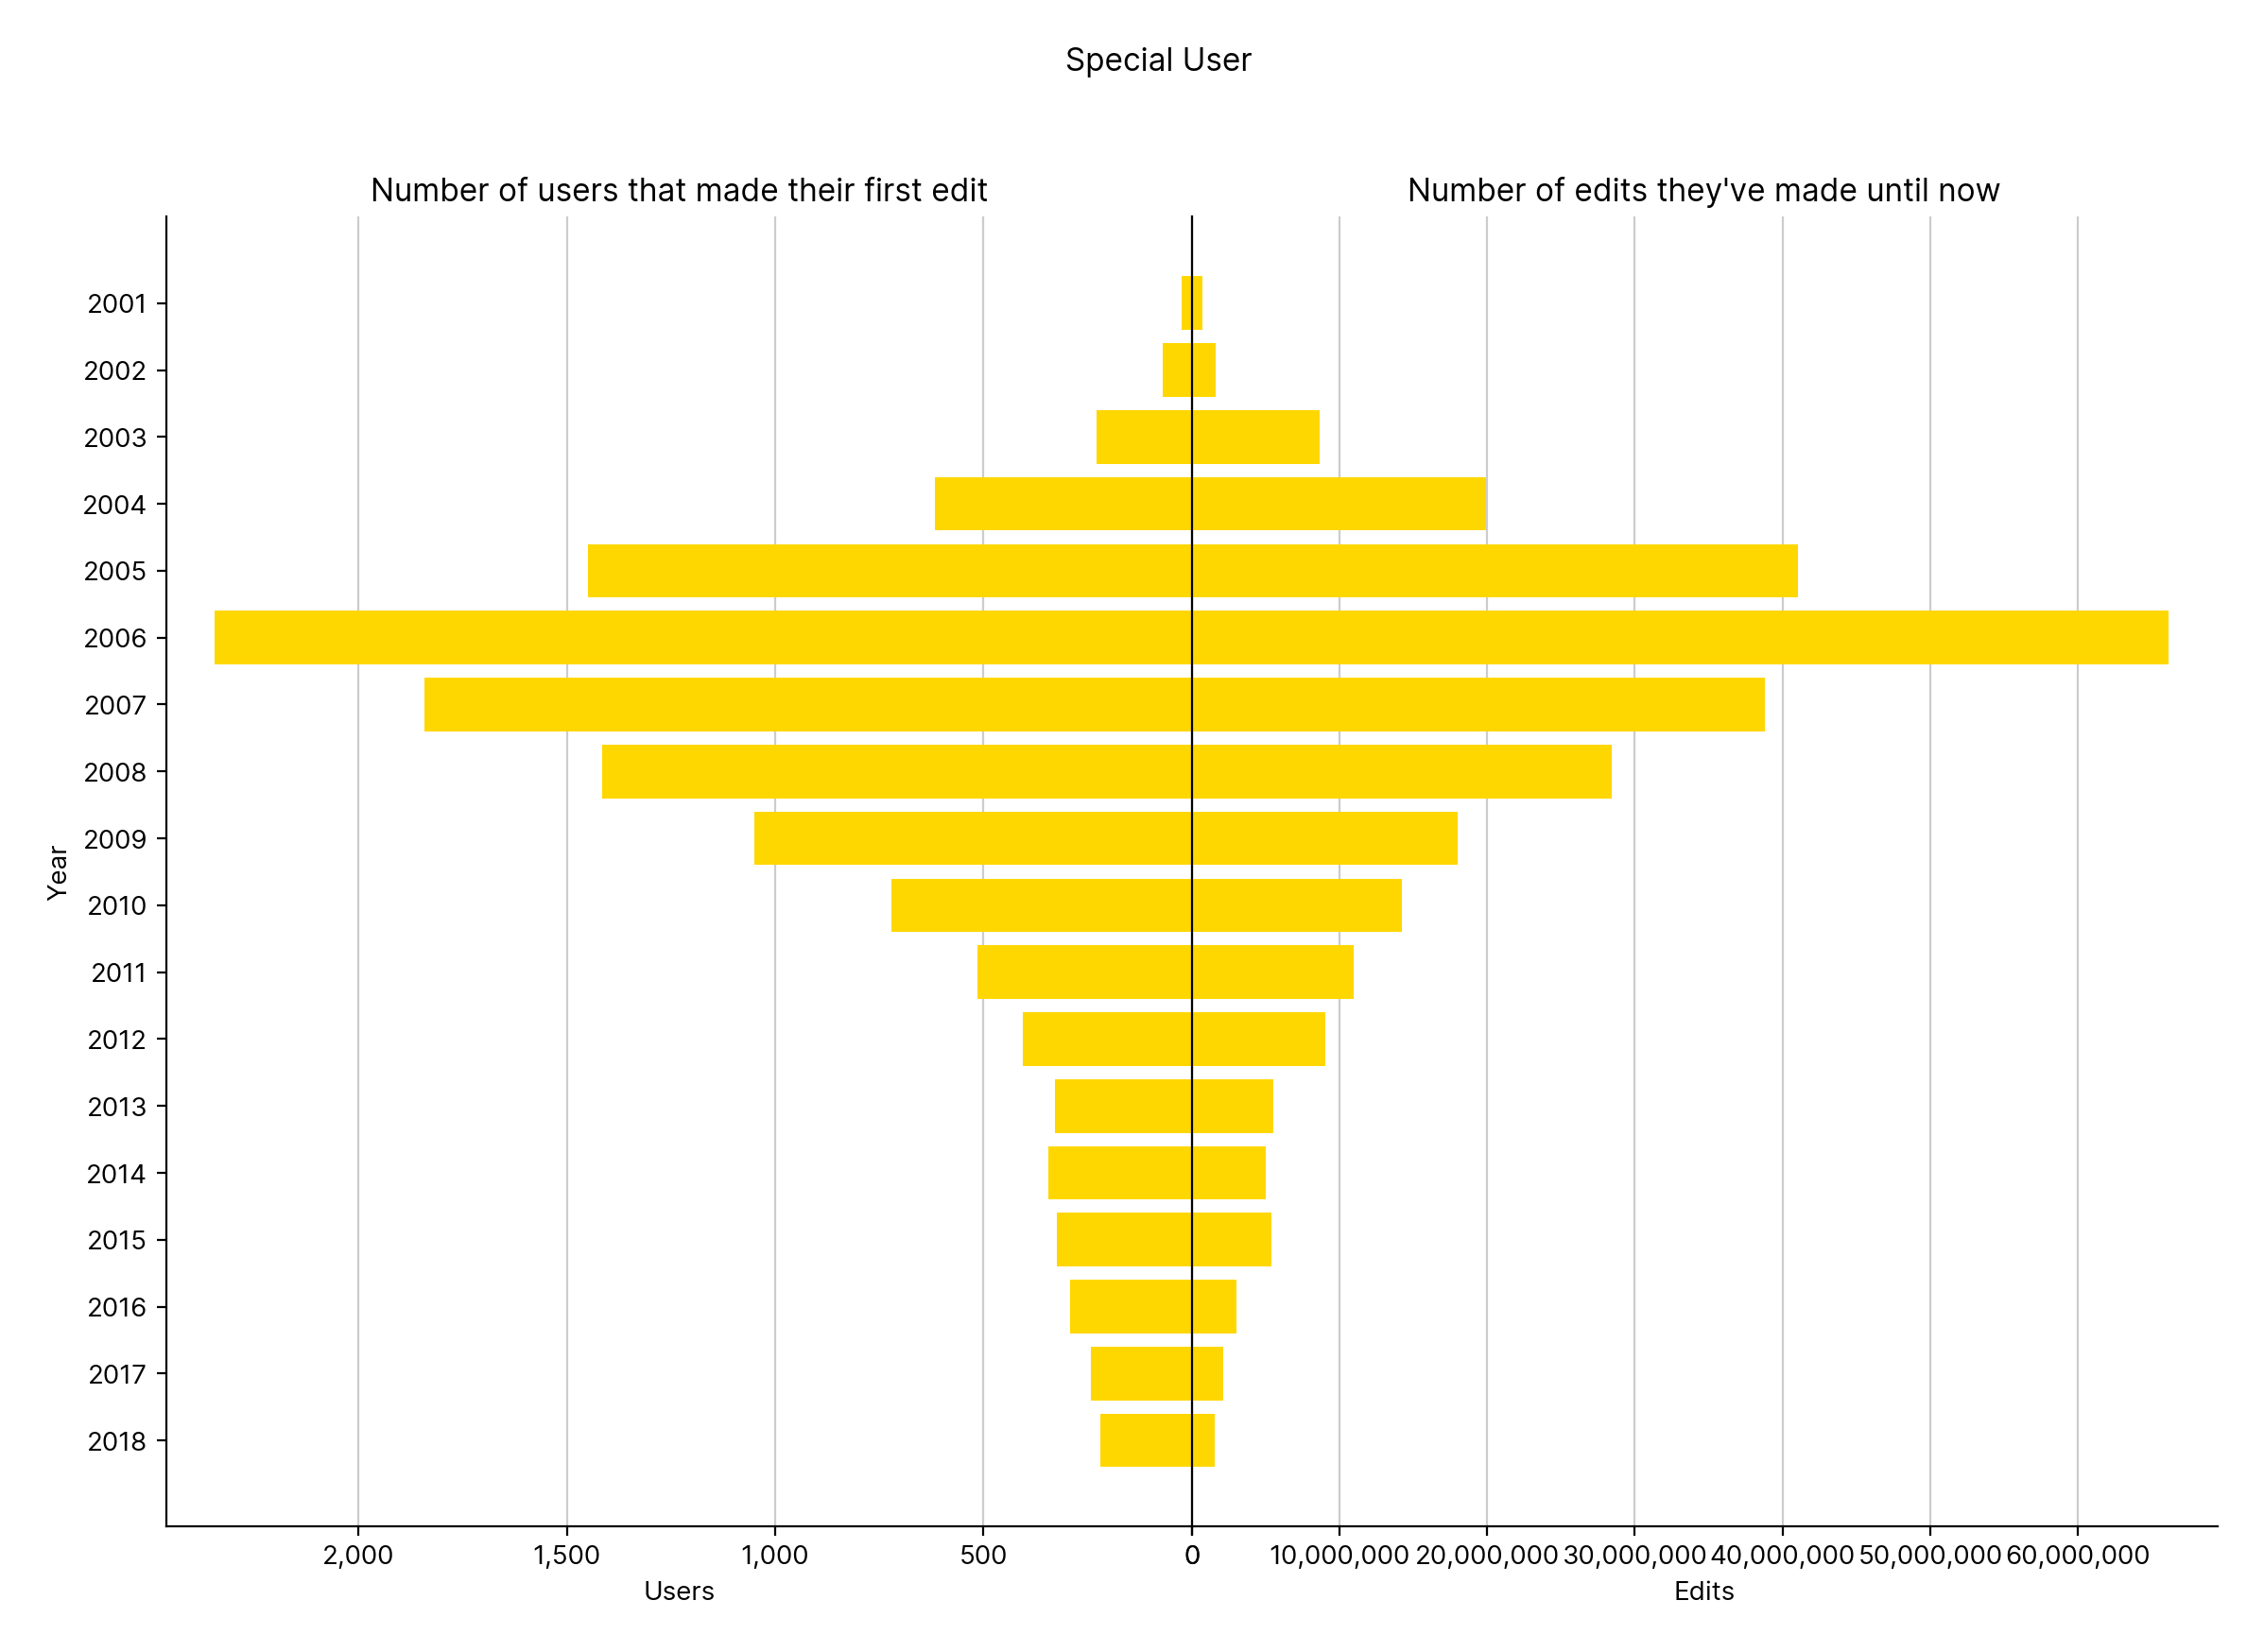
Figure 7.2
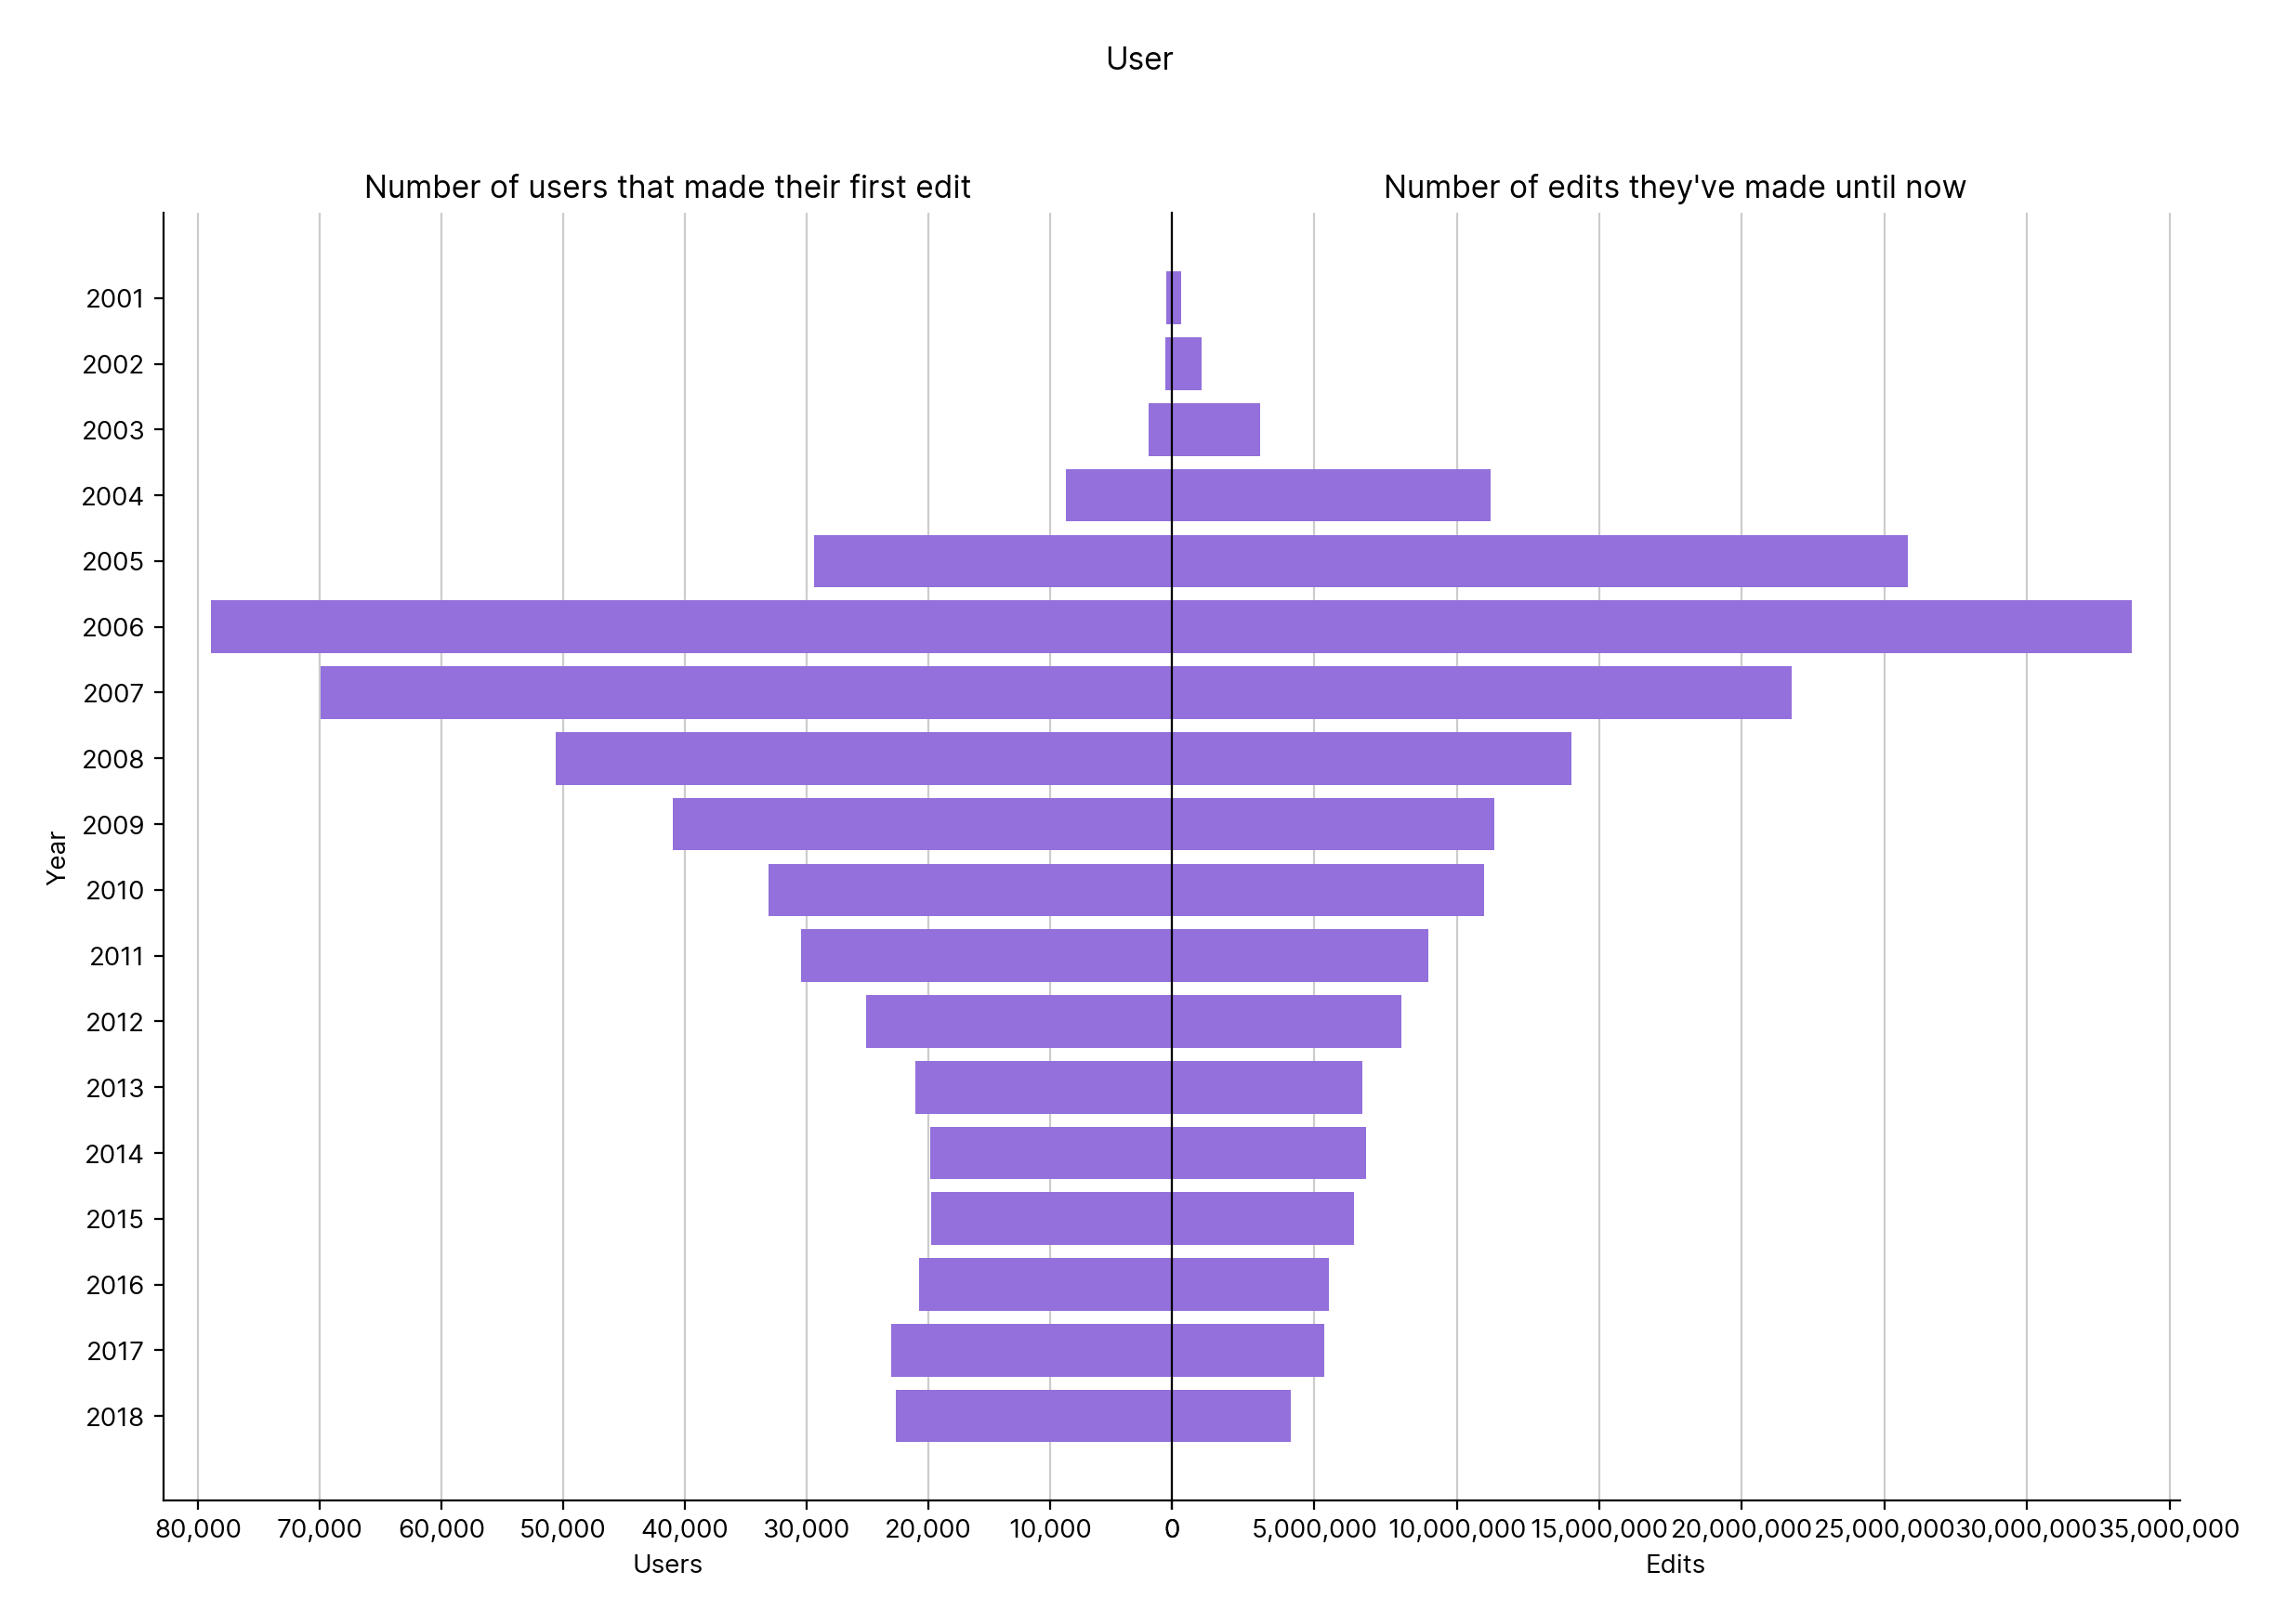
Figure 7.3
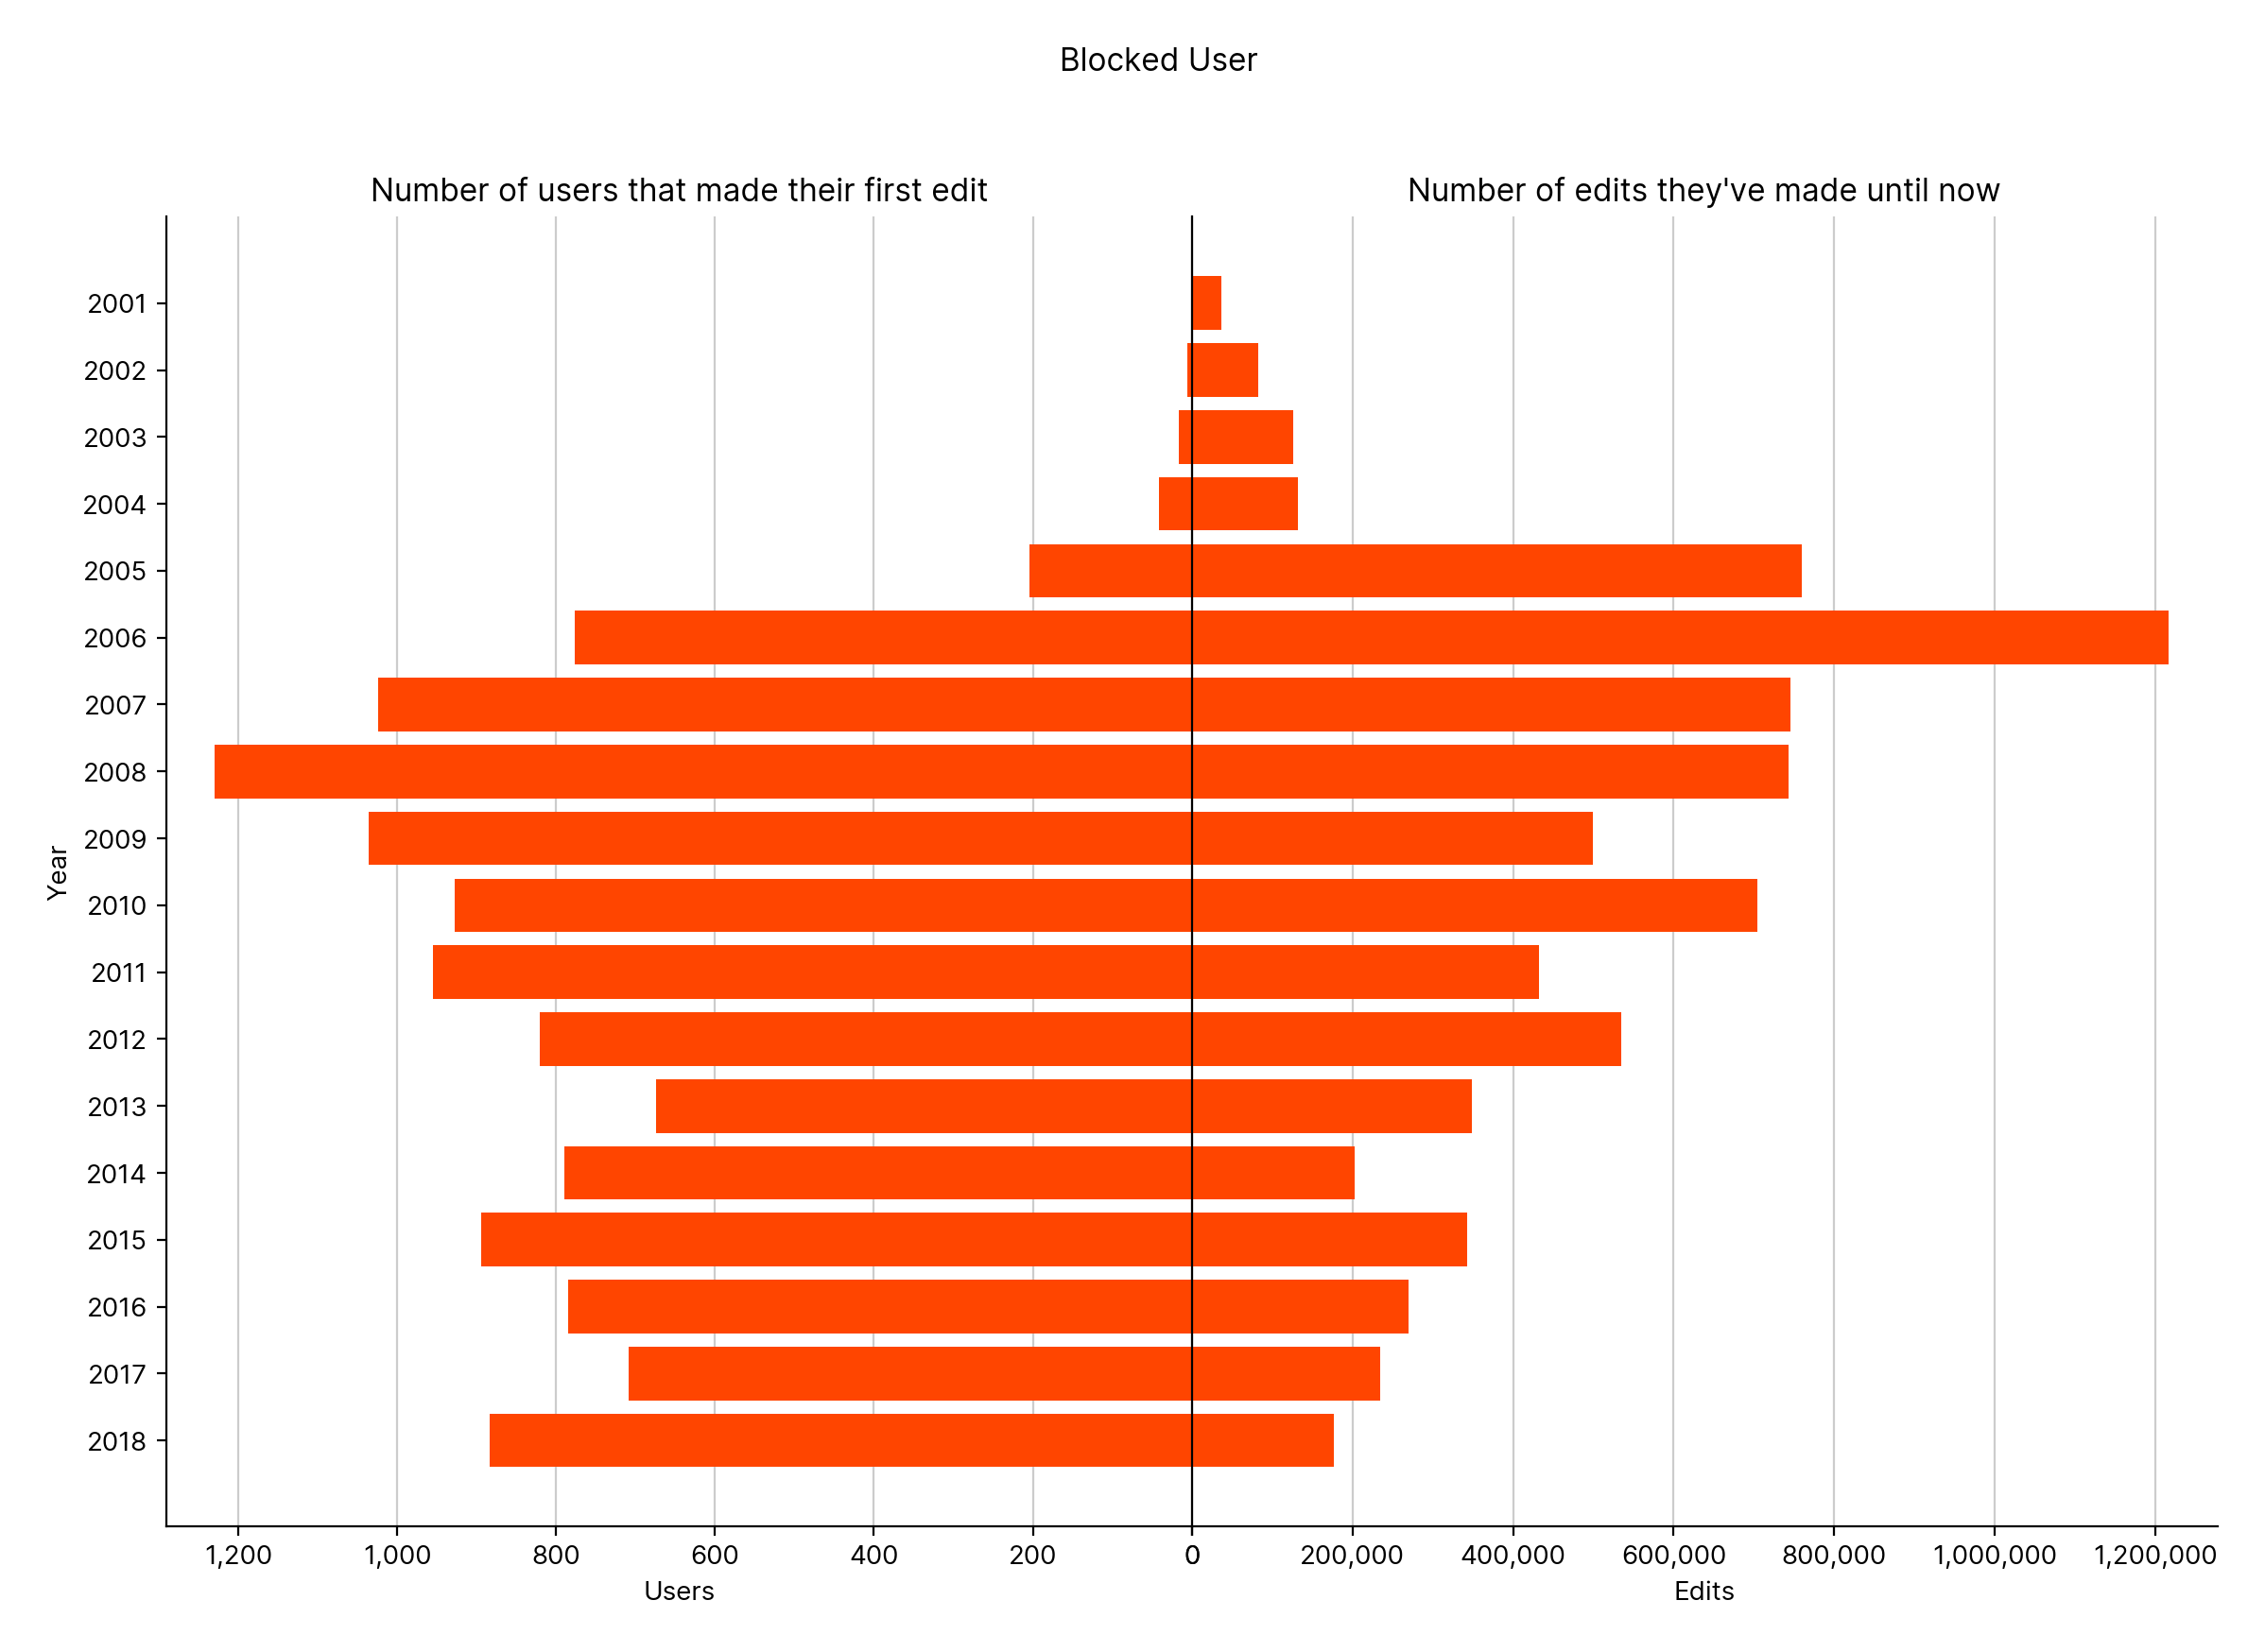
Figure 7.4
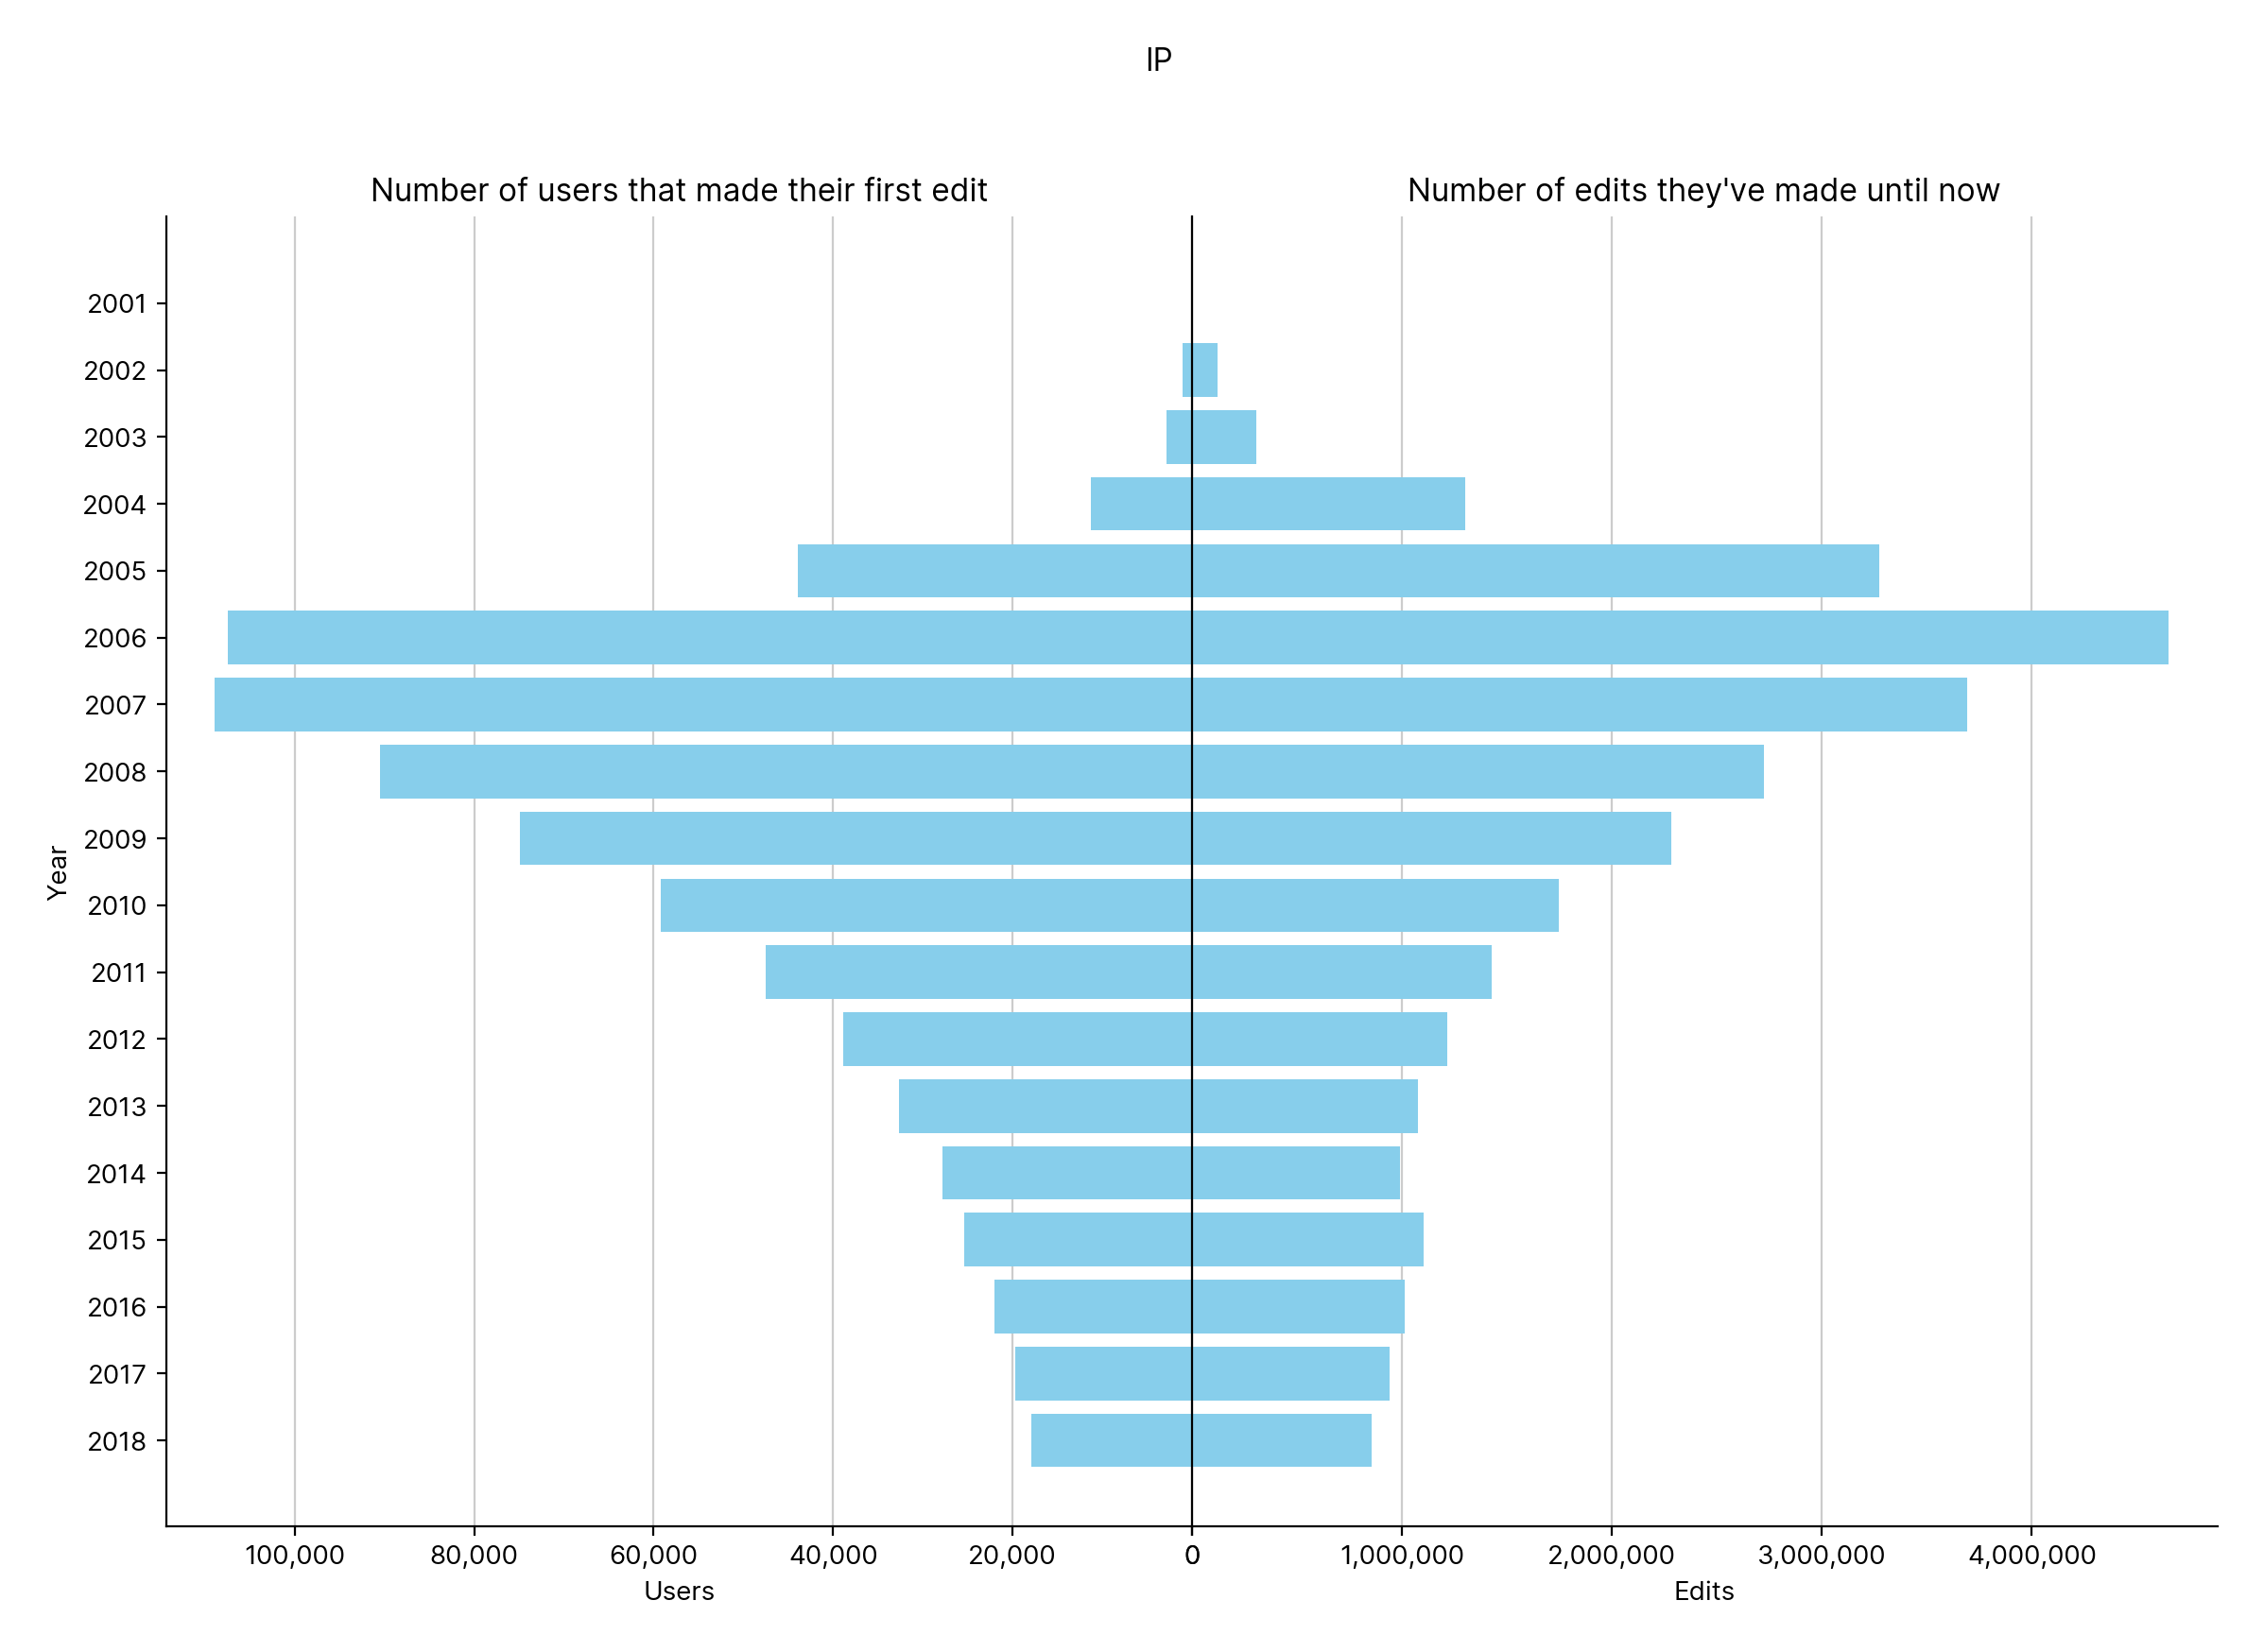
Figure 7.5
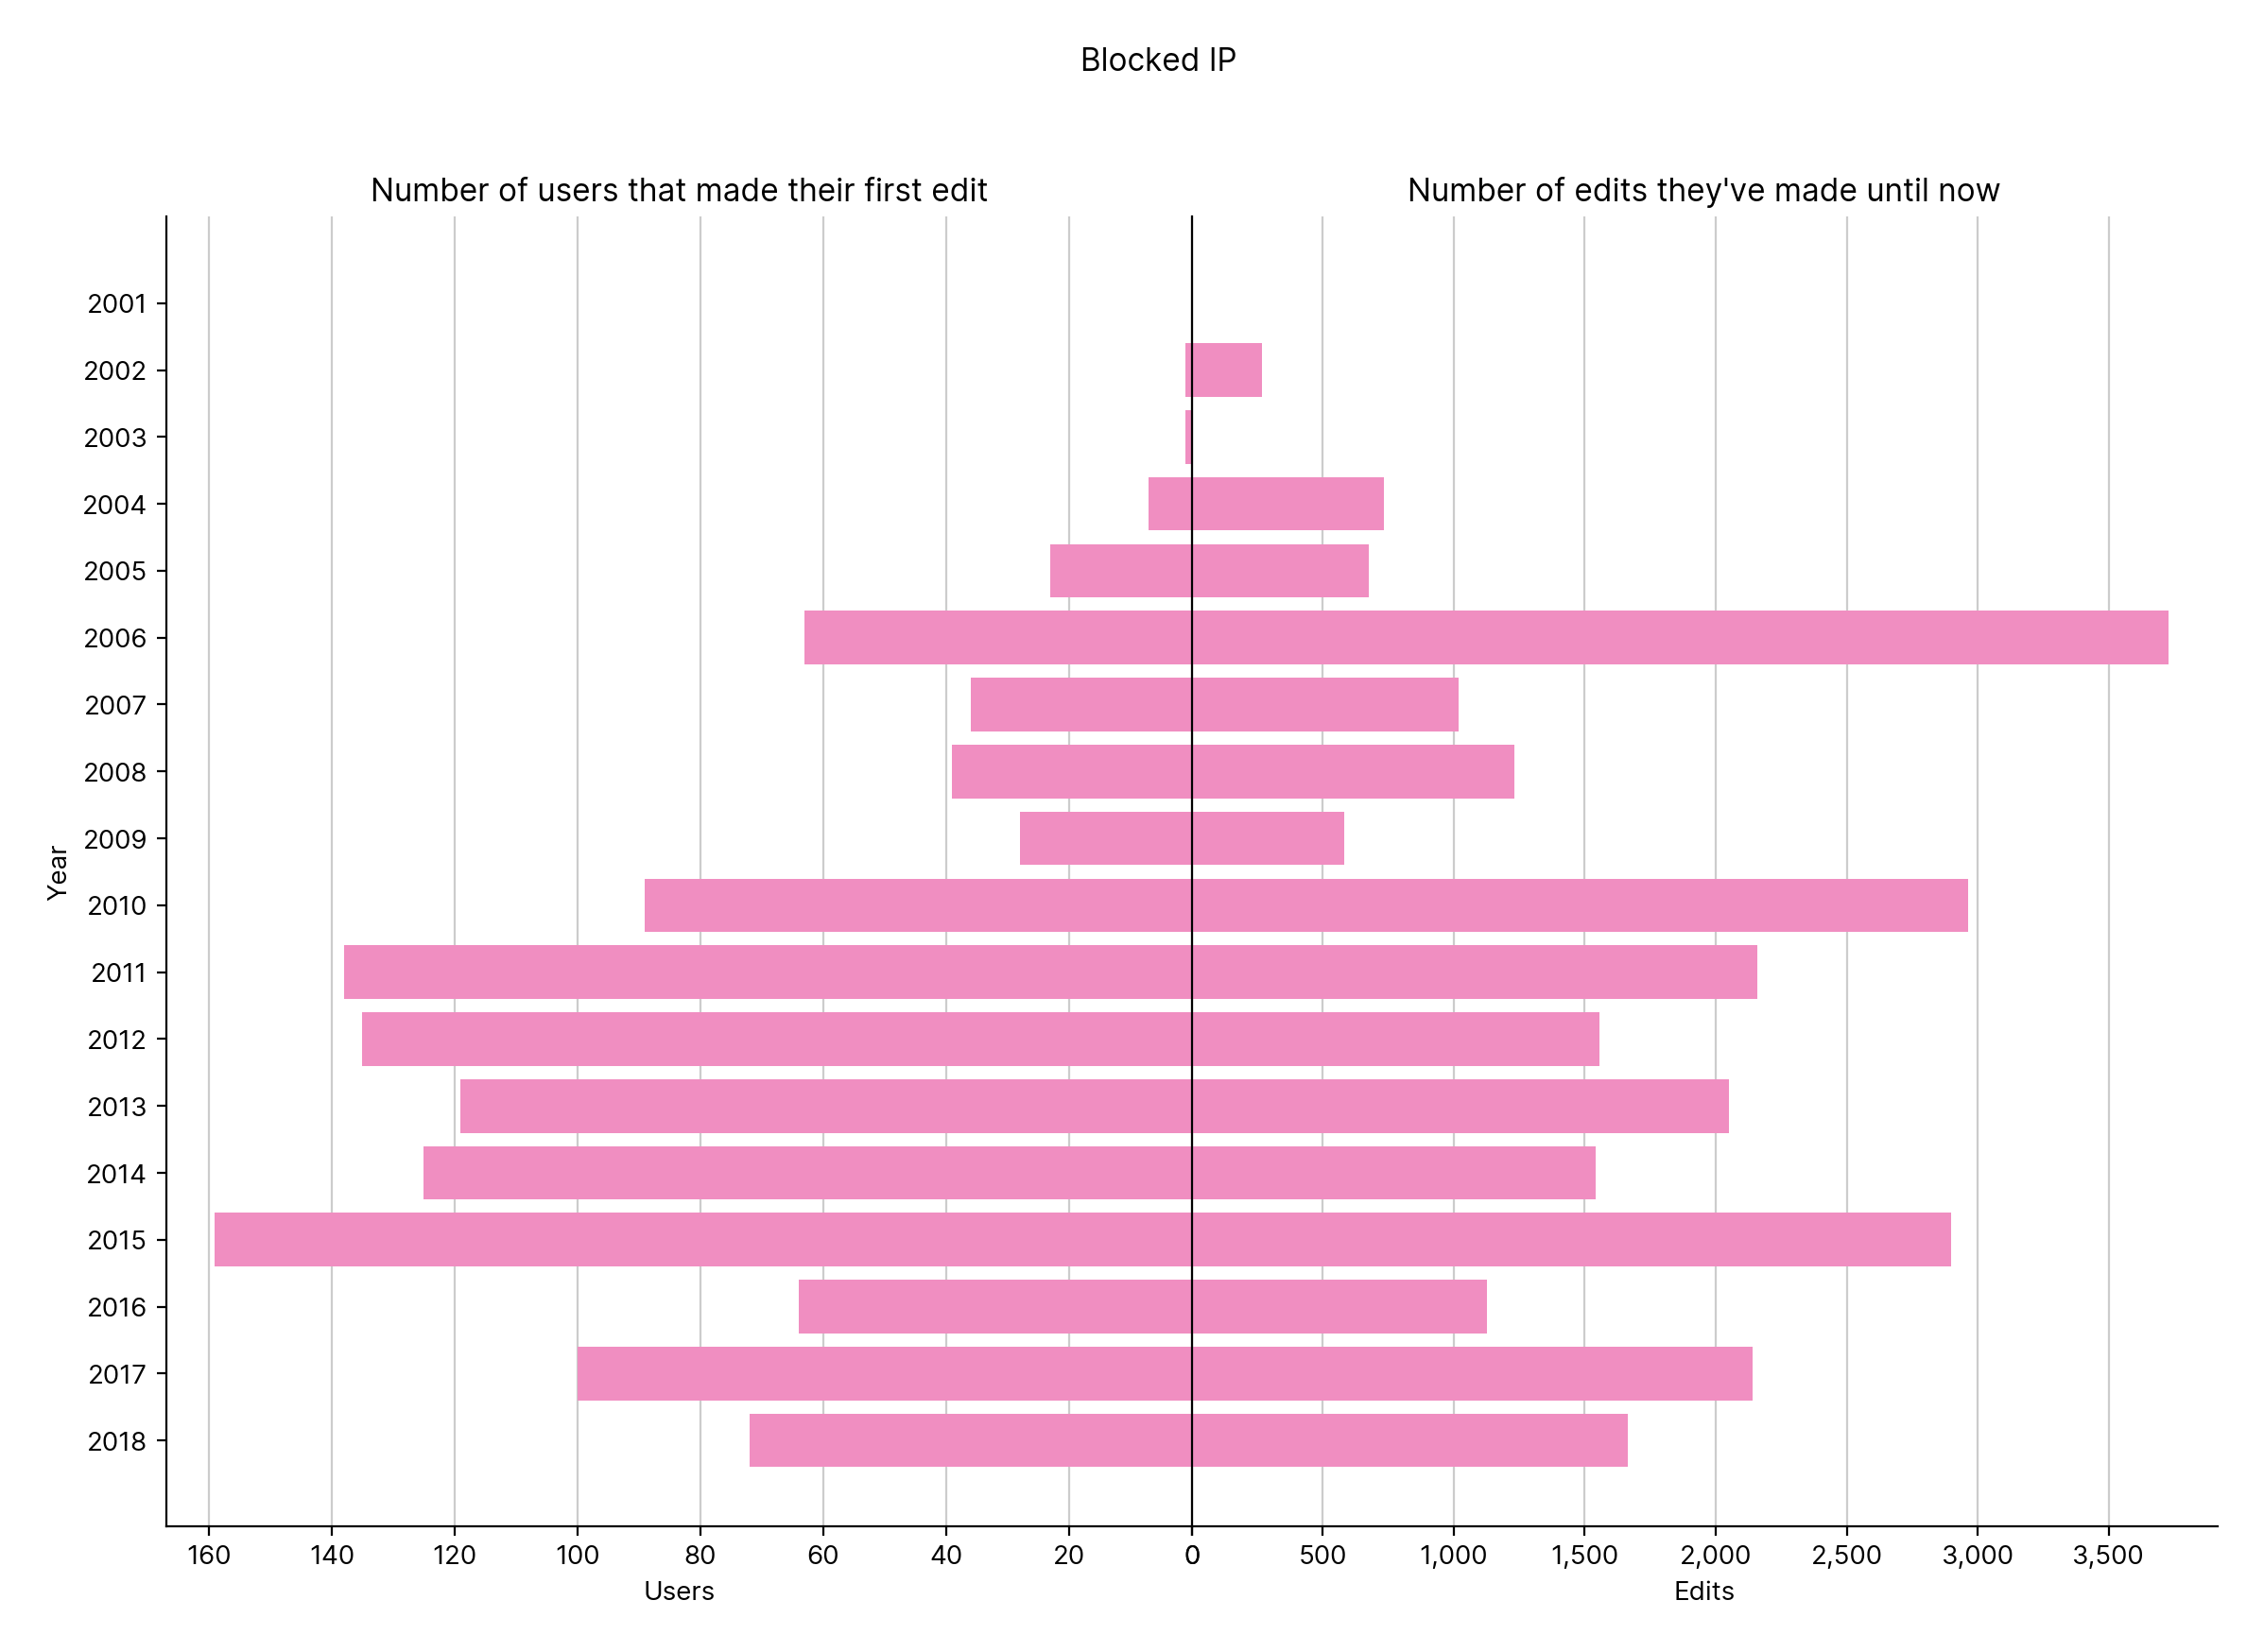
Figure 7.6
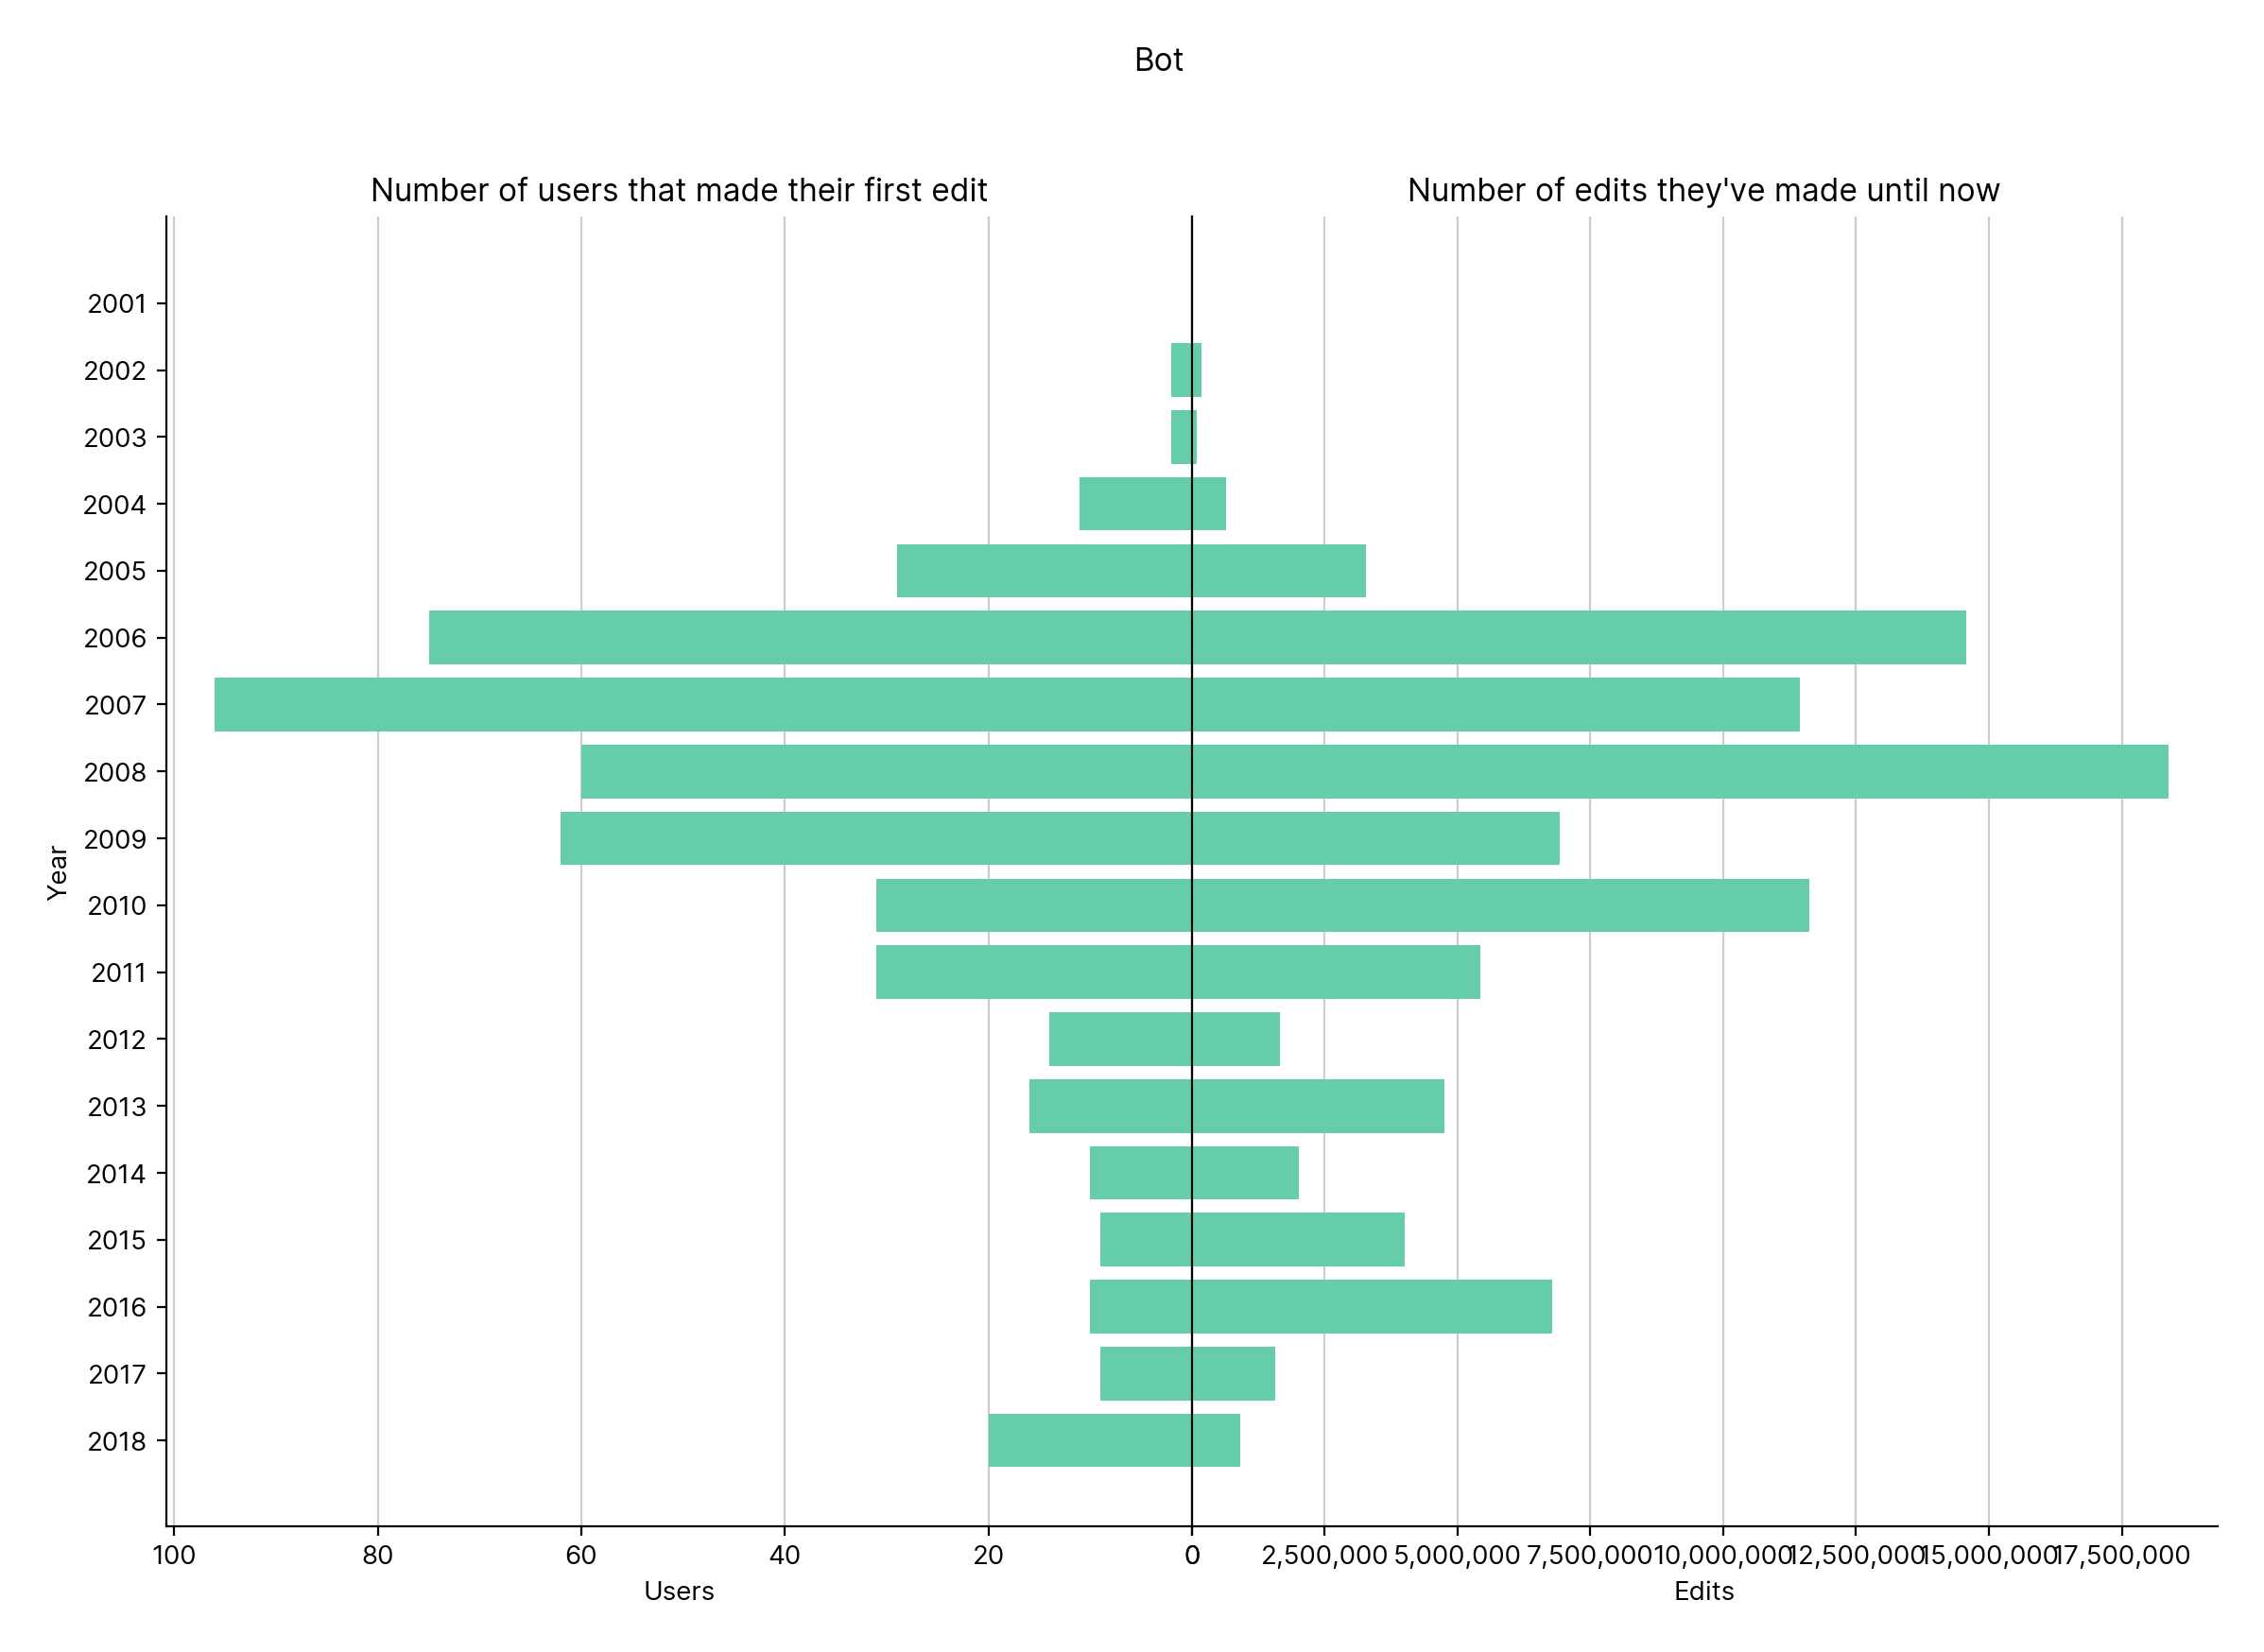
Figure 7.7

Figure 38.1
Figure 38.2
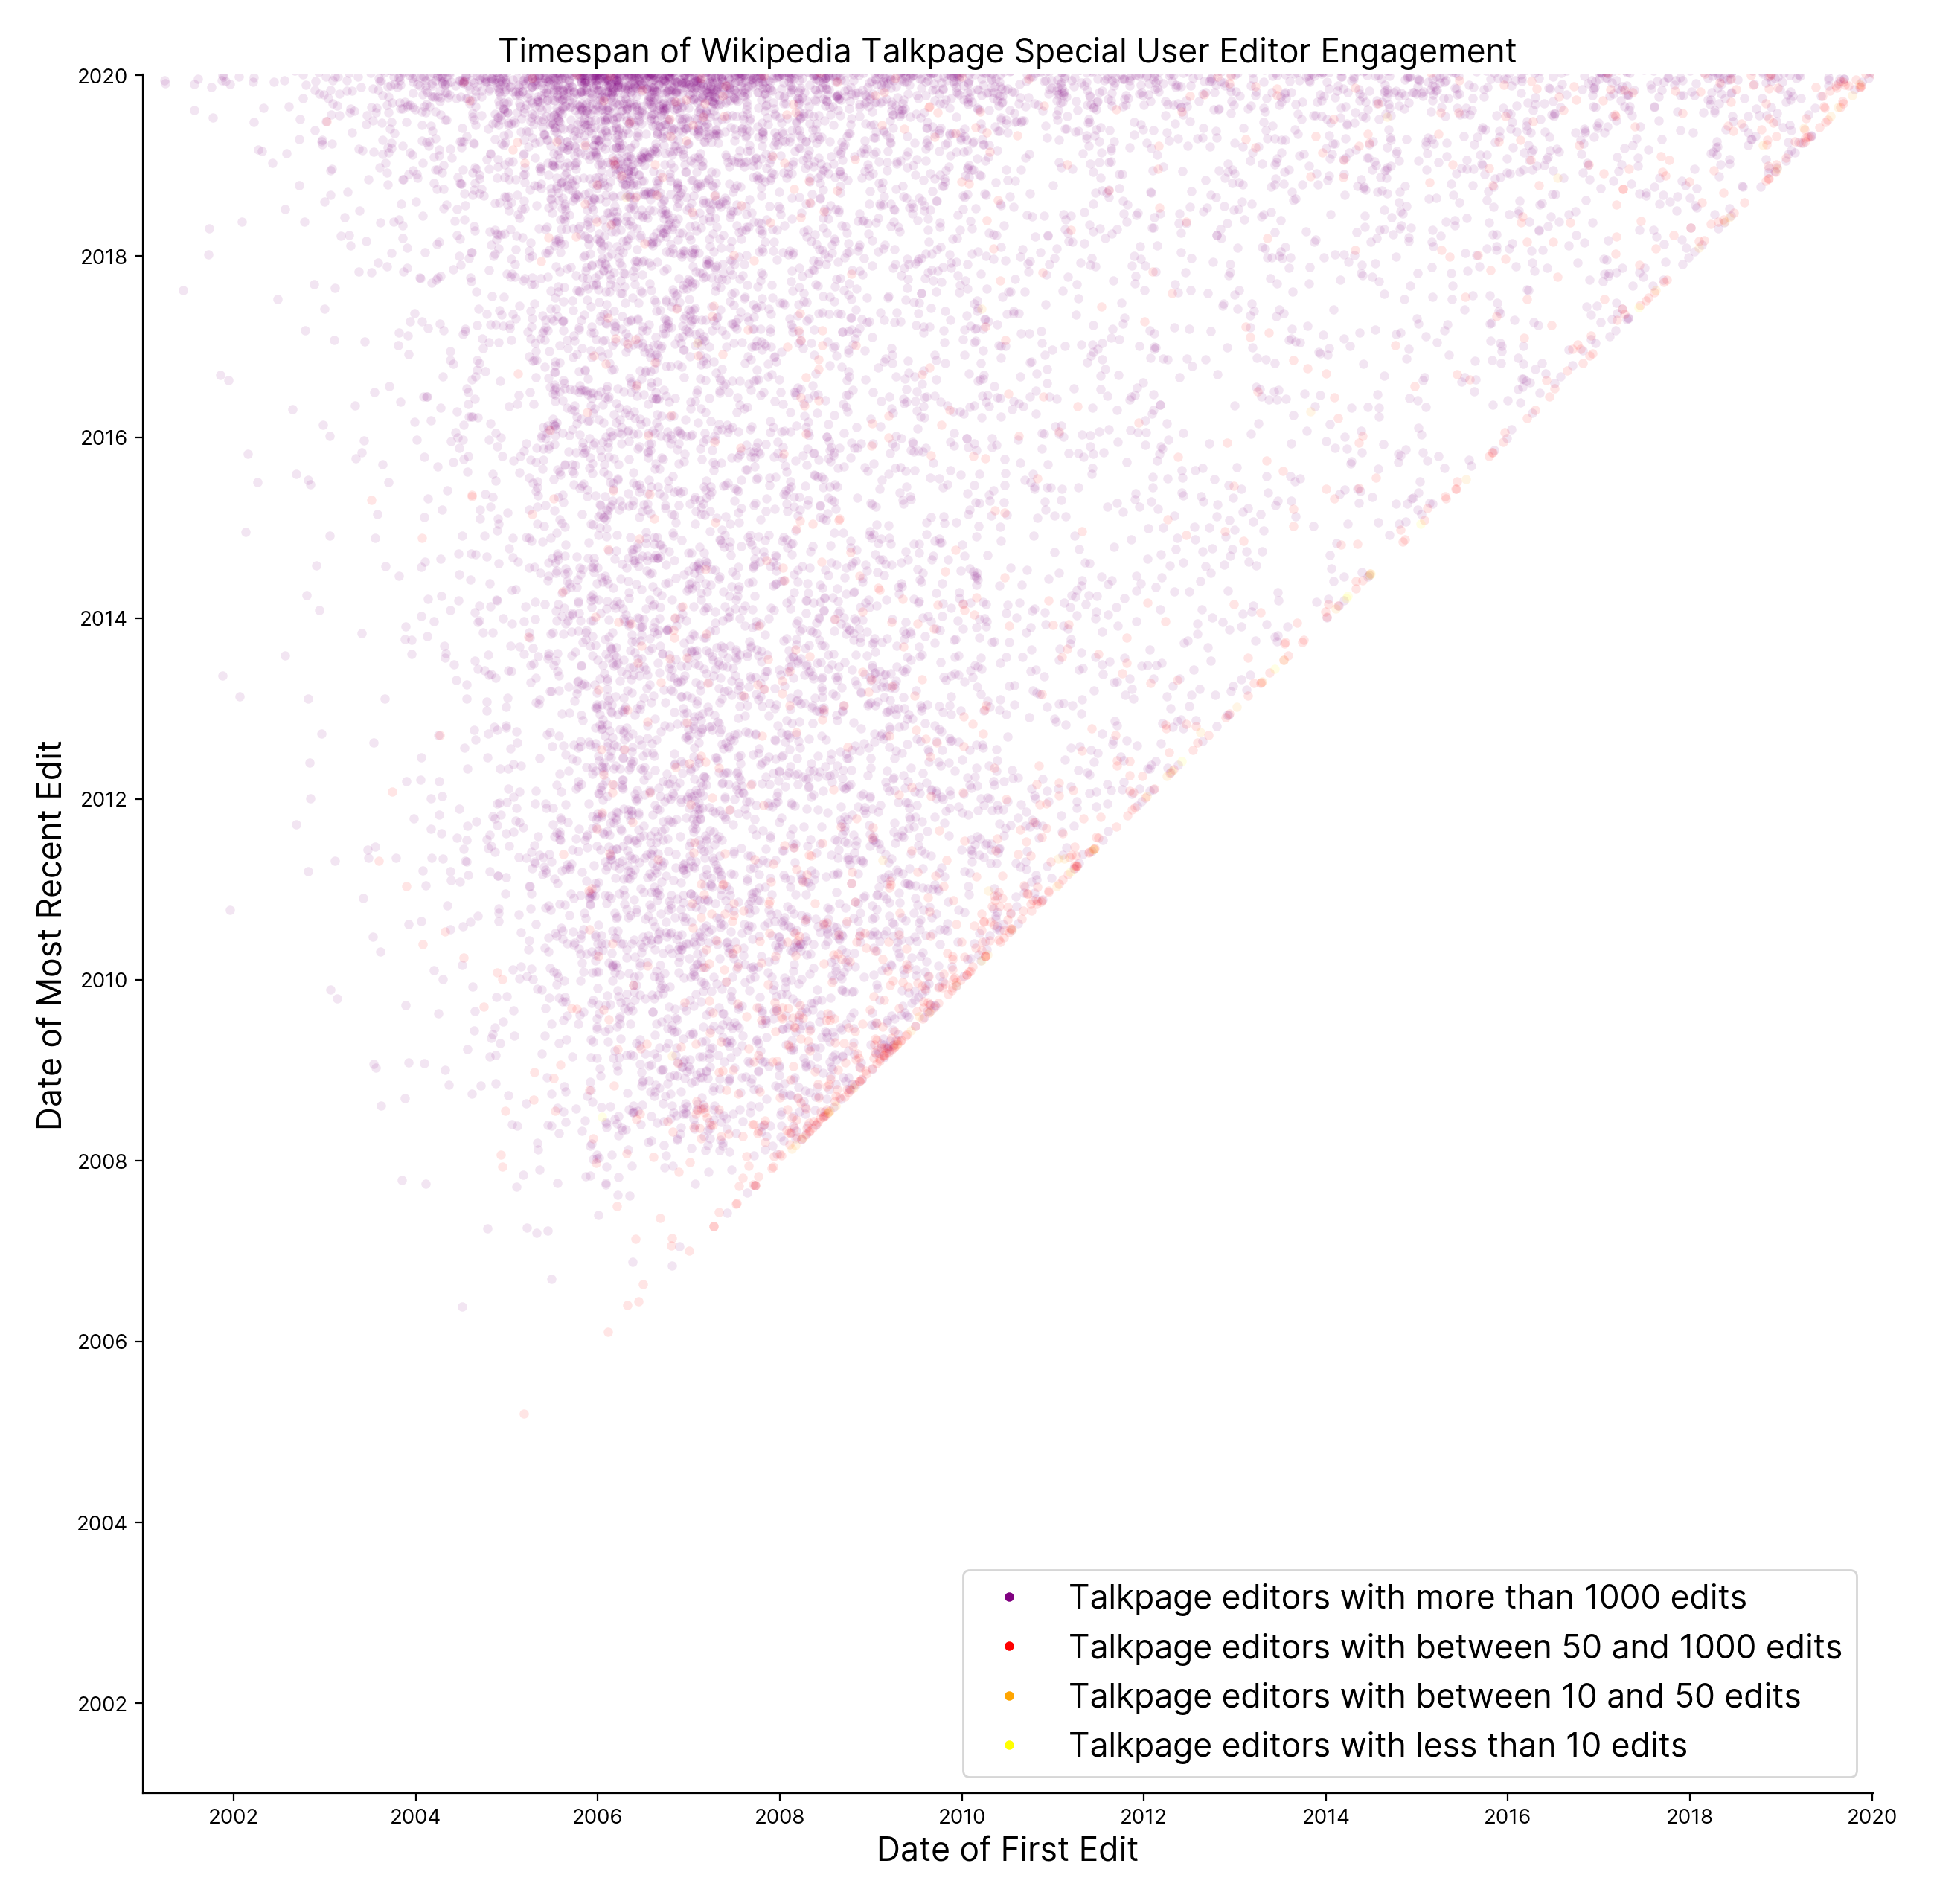
Figure 38.3
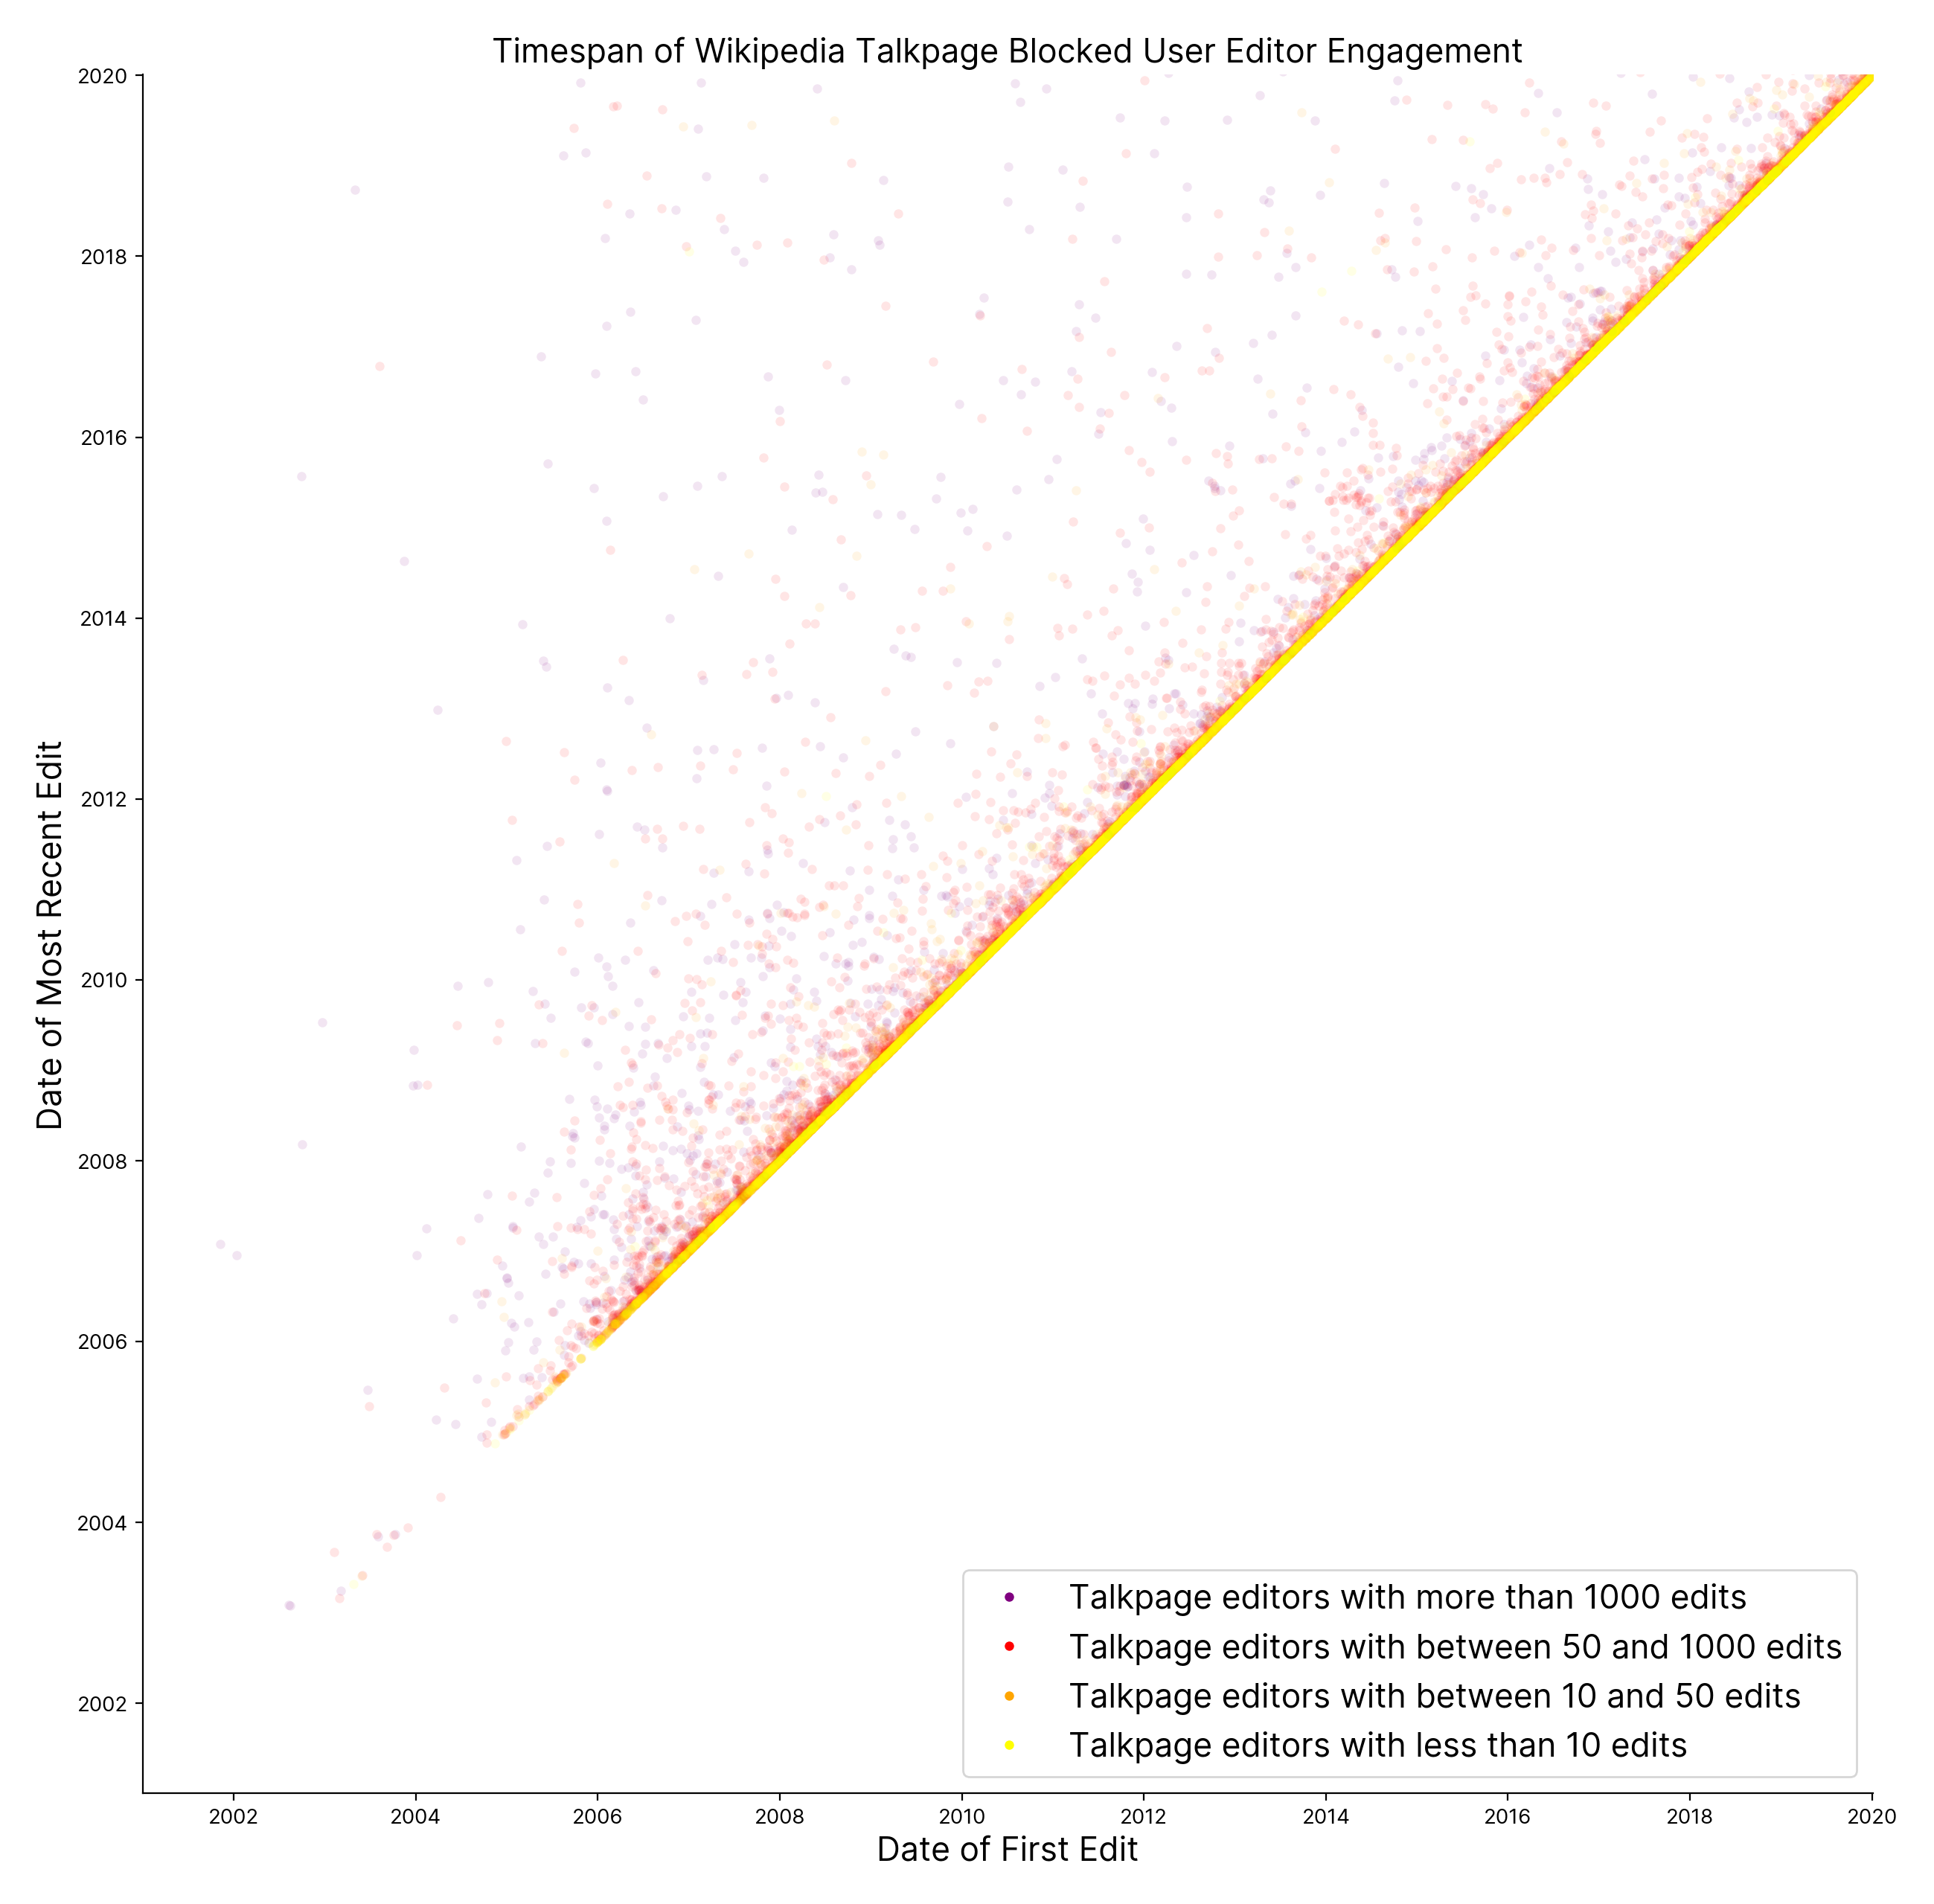
Figure 38.4
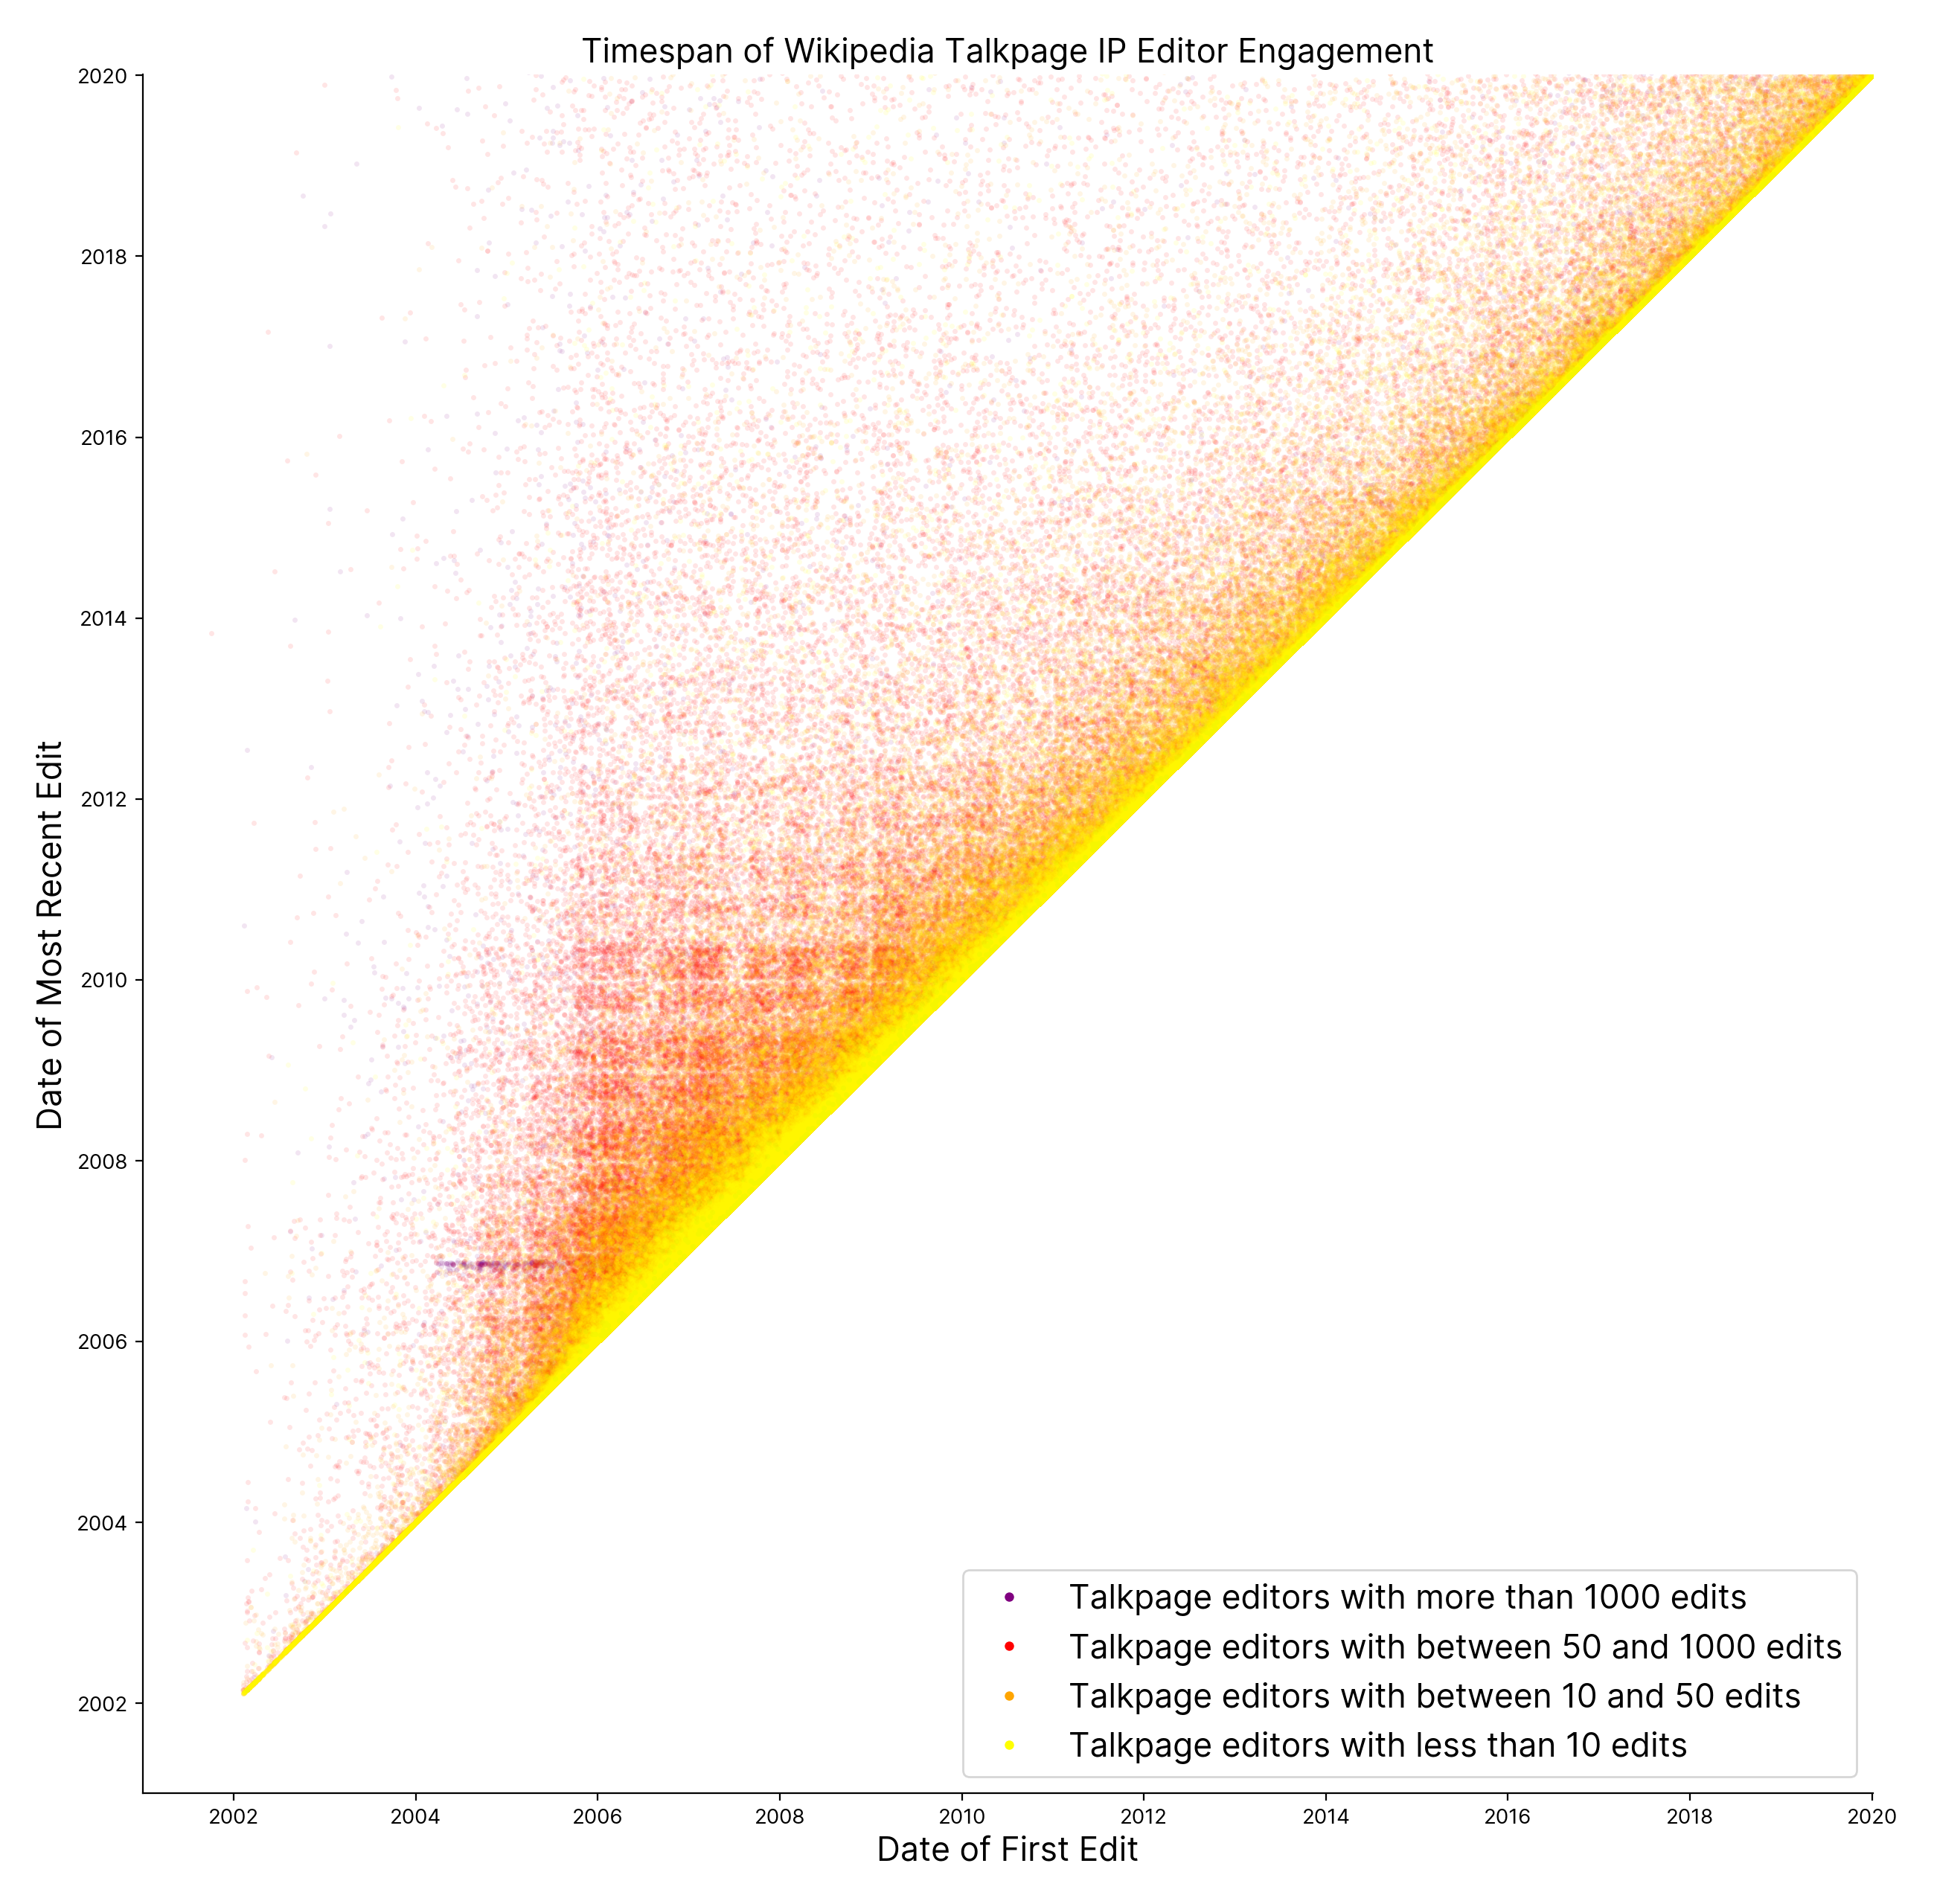
Figure 38.5
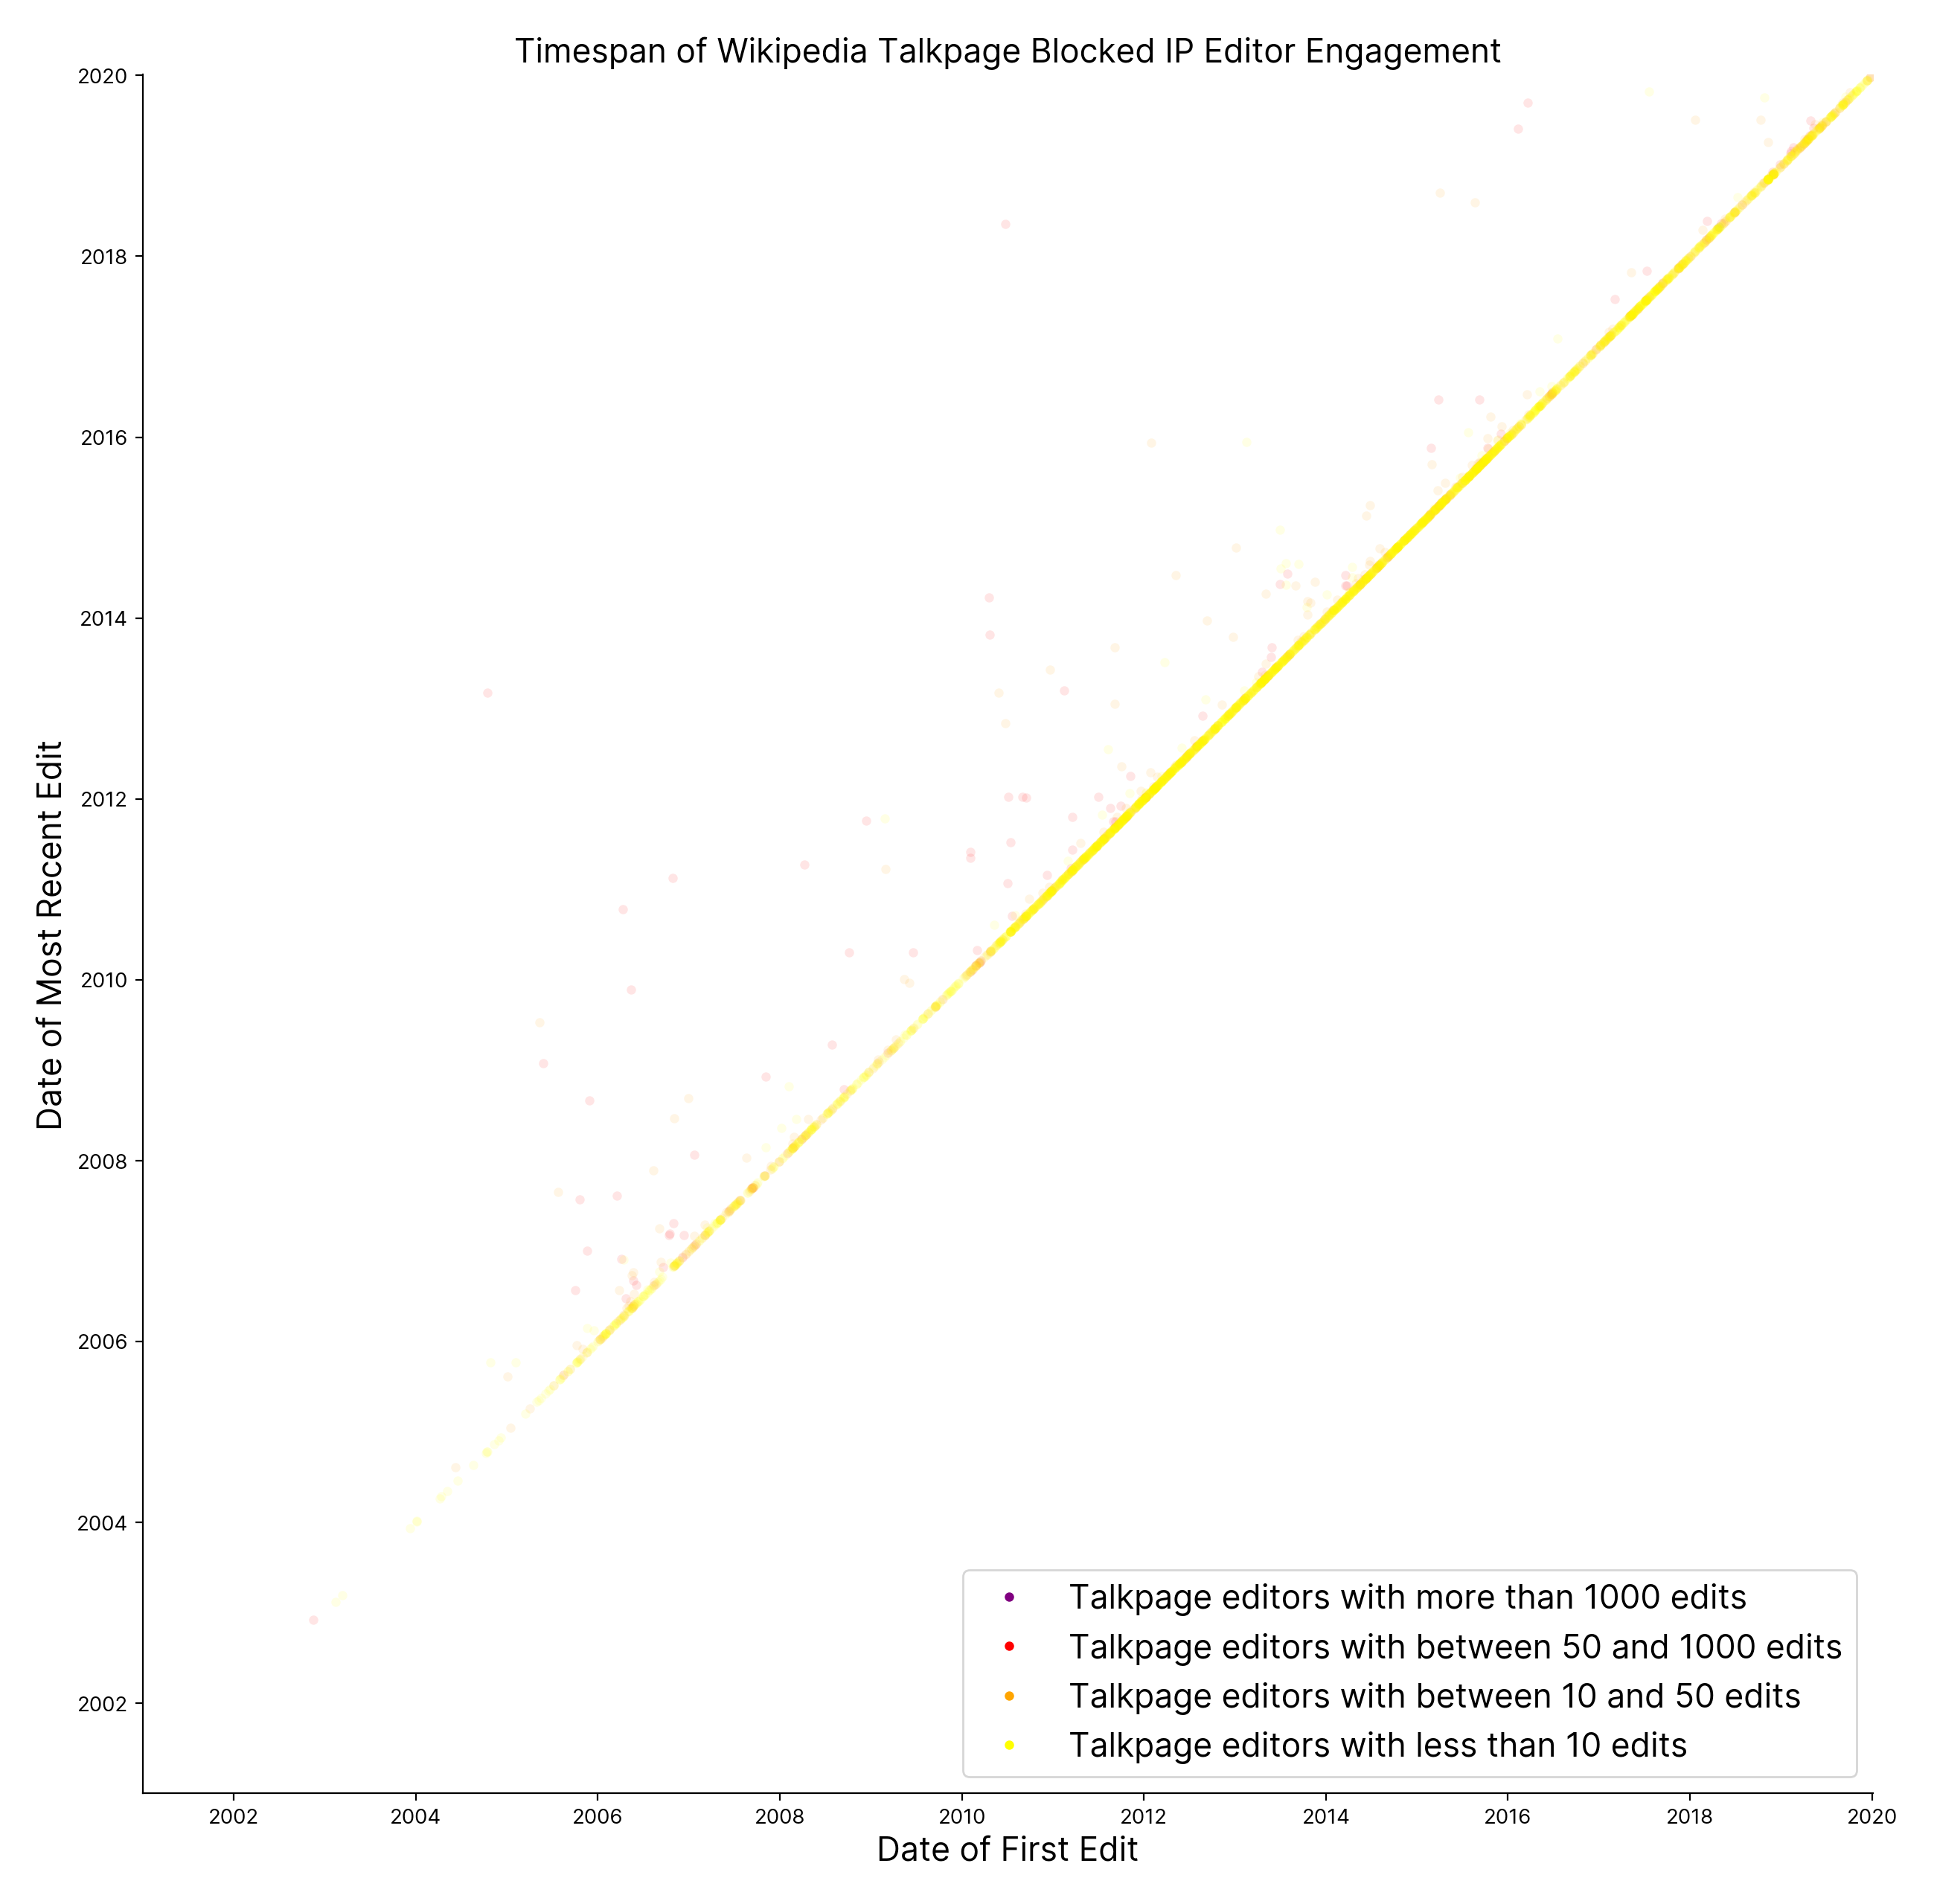
Figure 38.6
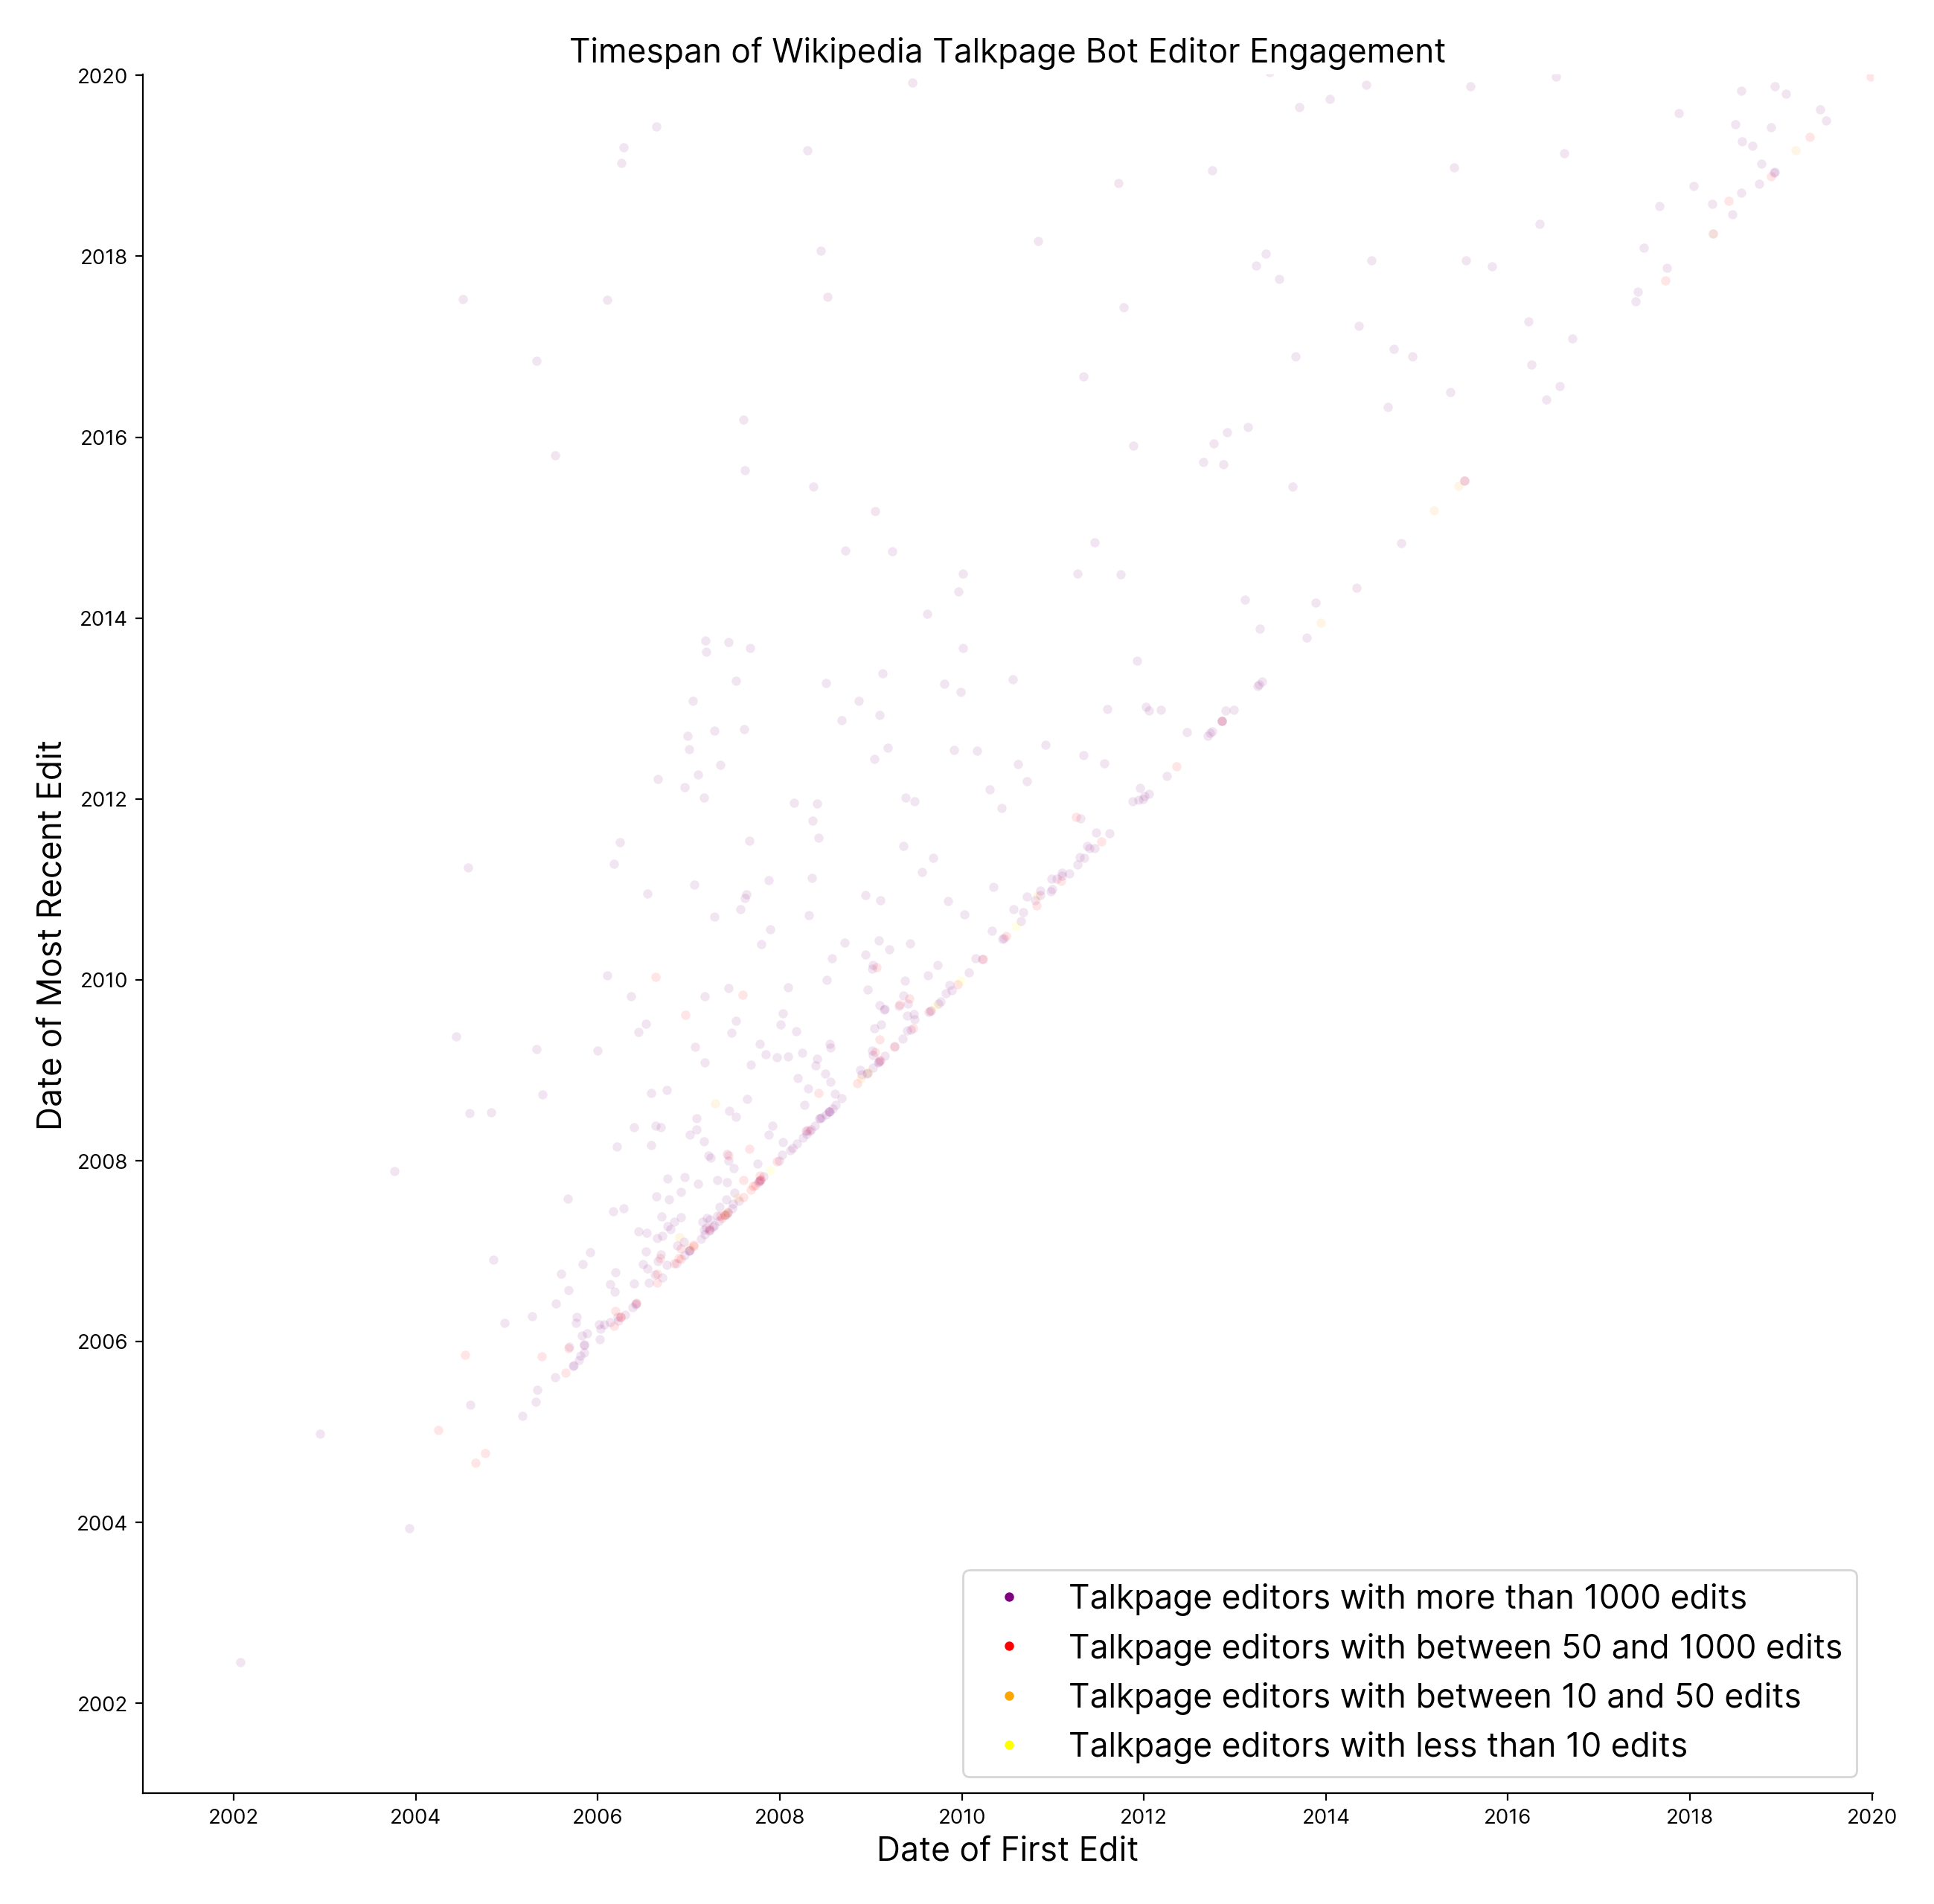
Figure 38.7
Figure 39
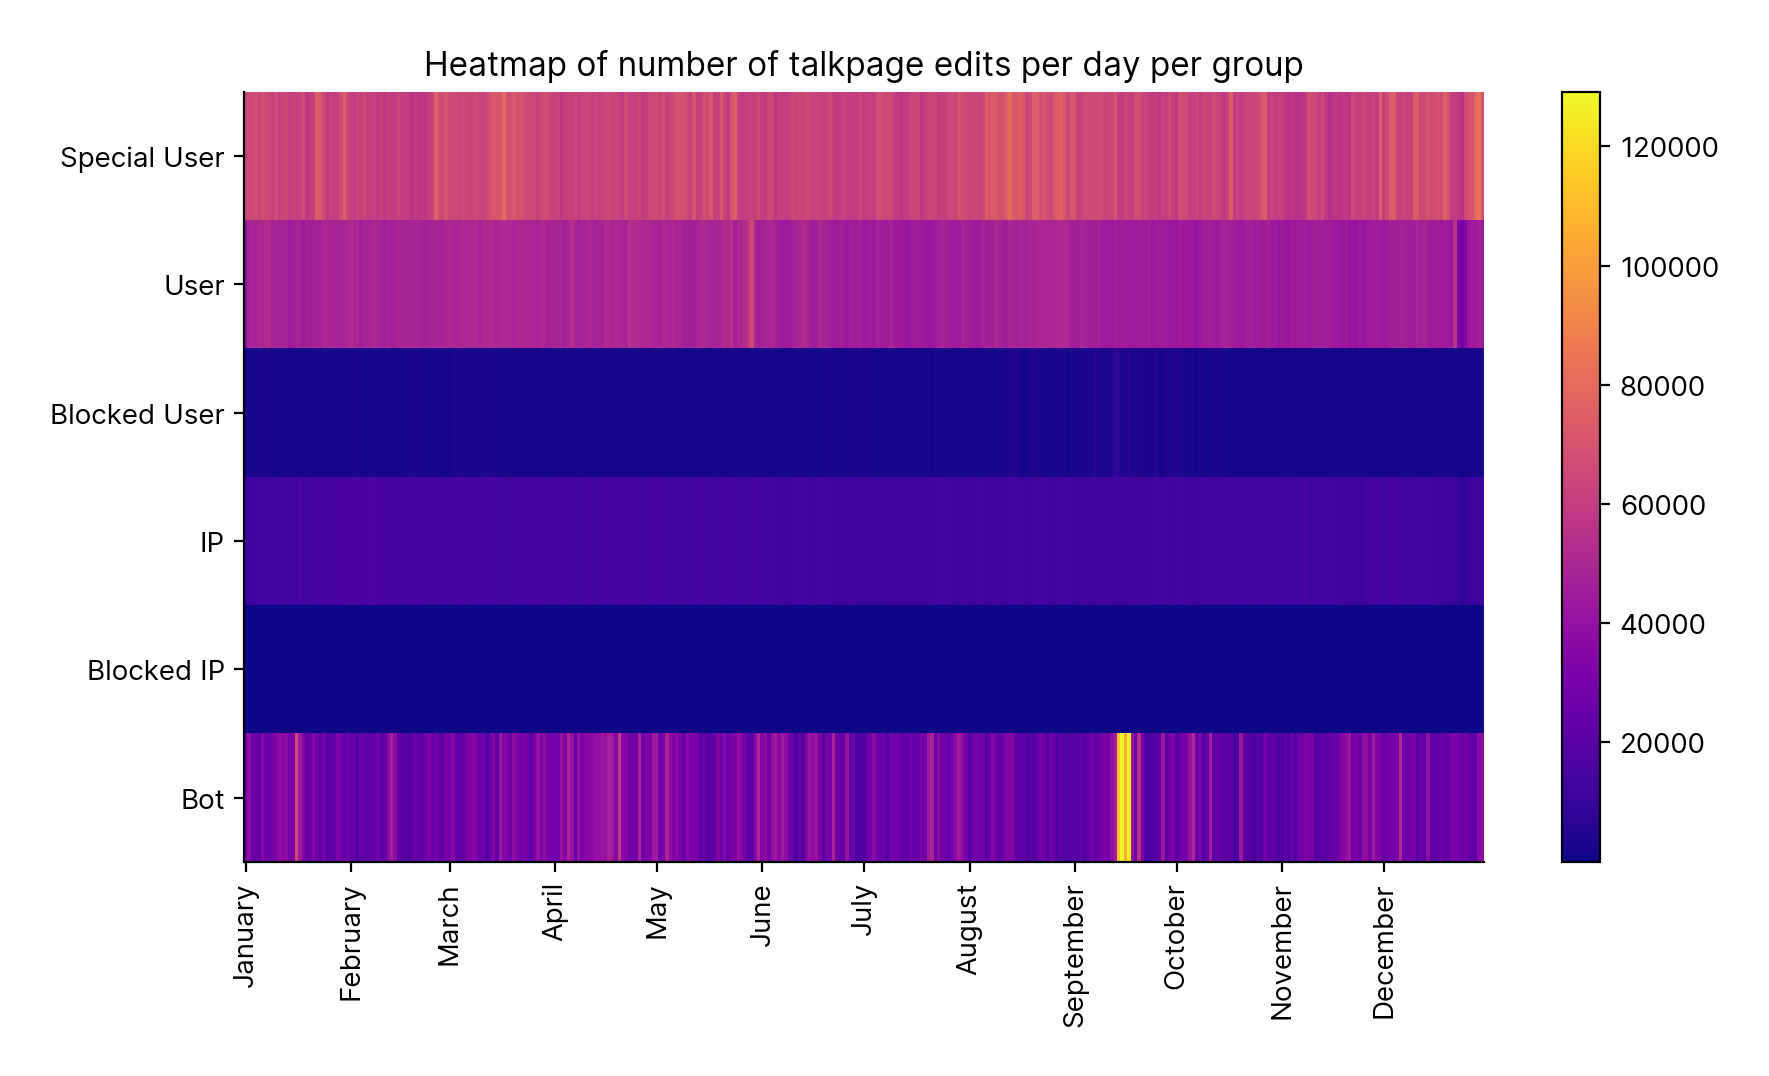
Figure 42.1
Figure 42.2
Figure 42.3
Talkpage Edits
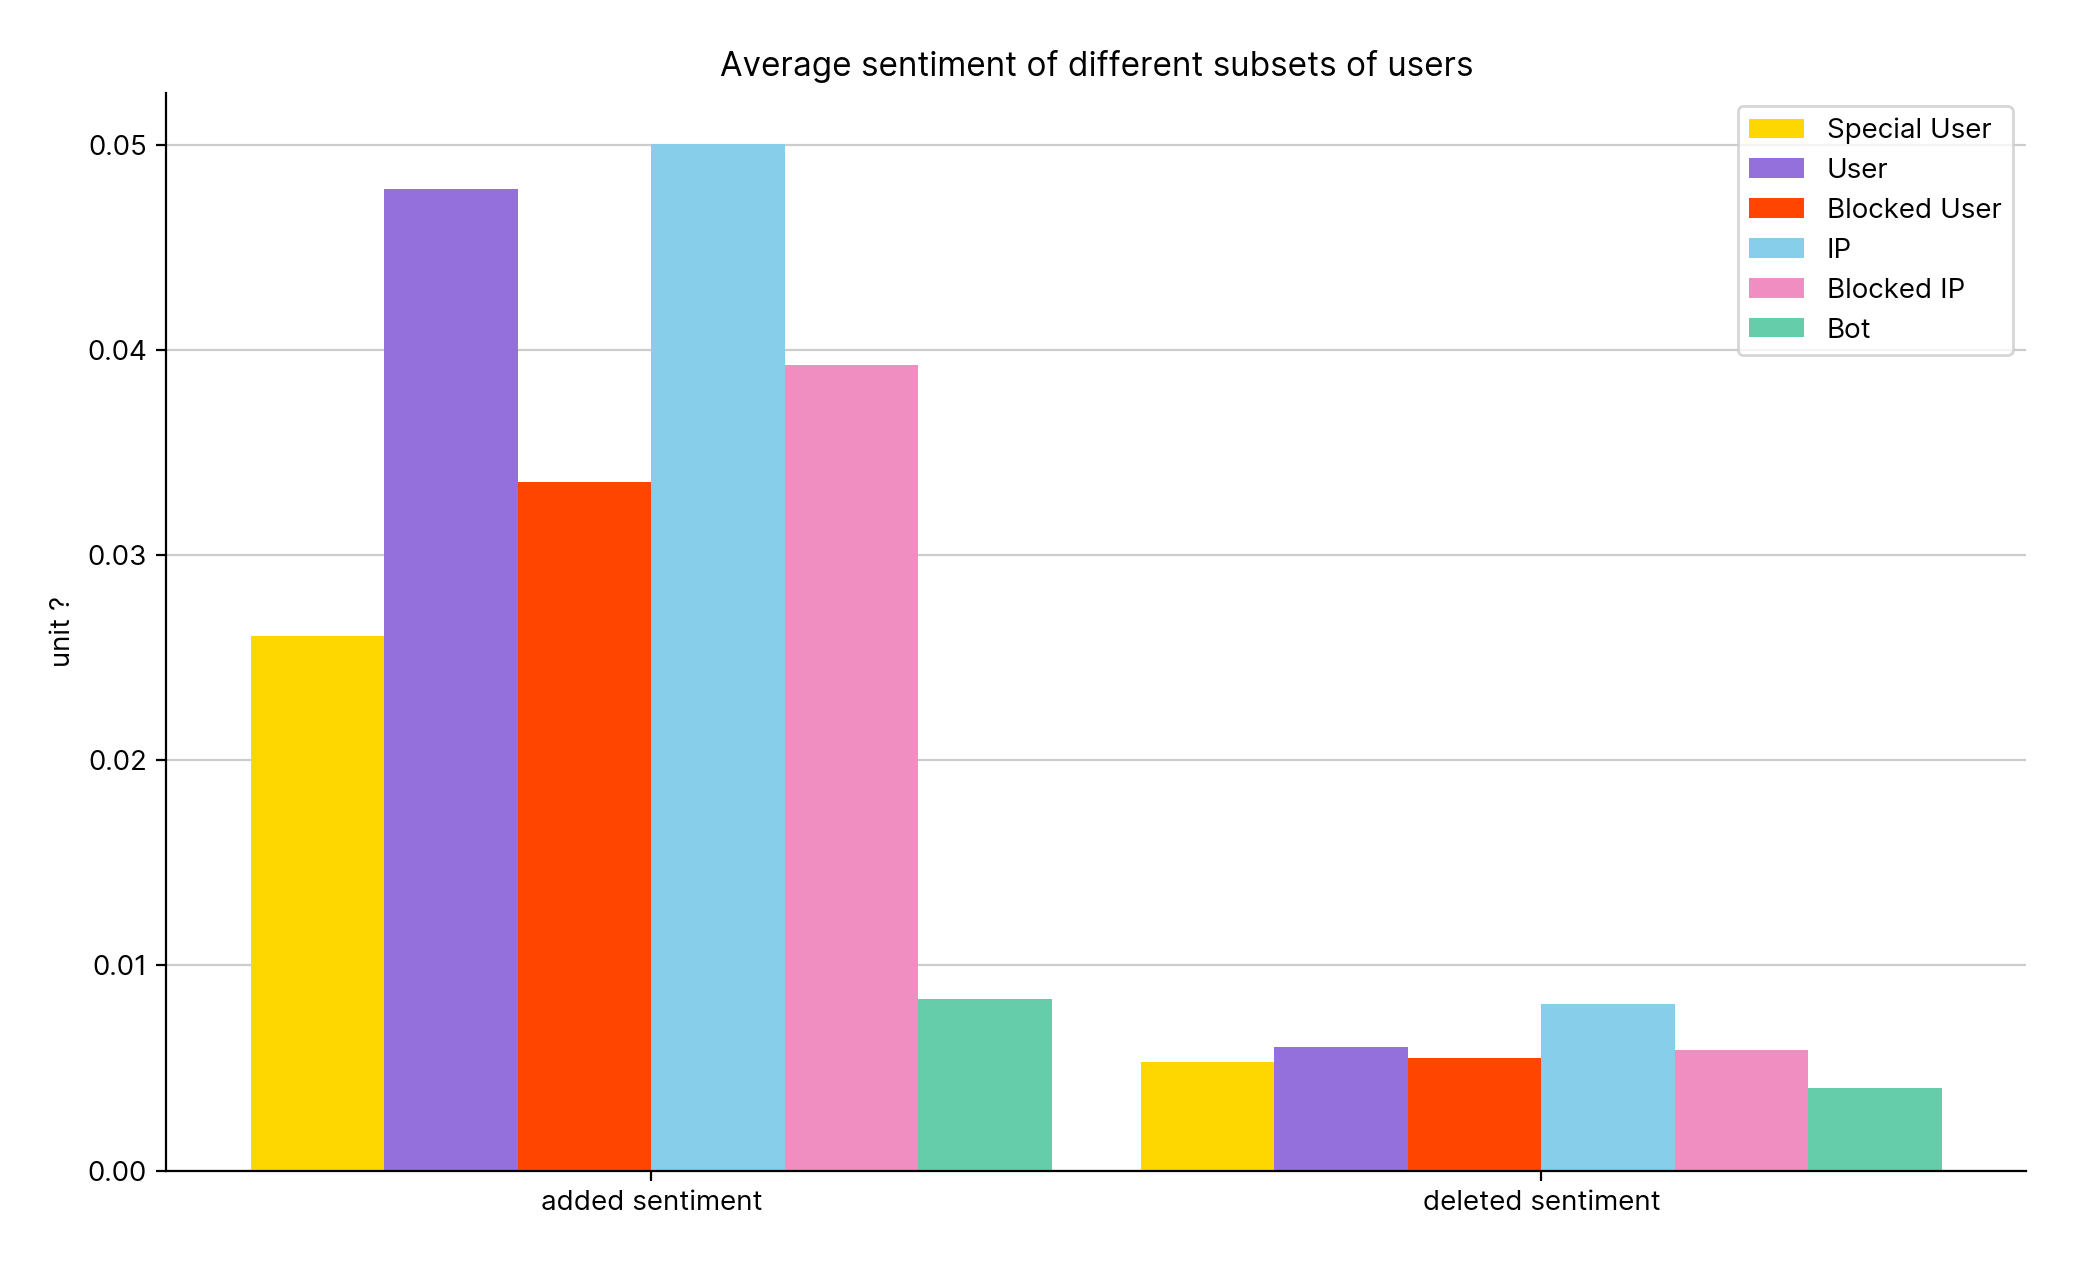
Figure 12
Experimentally we applied TextBlob to get the sentiment of talkpage edits. On average all edits add or remove positive content. As the average removed content is more neutral, we can imagine that more negative content is removed.
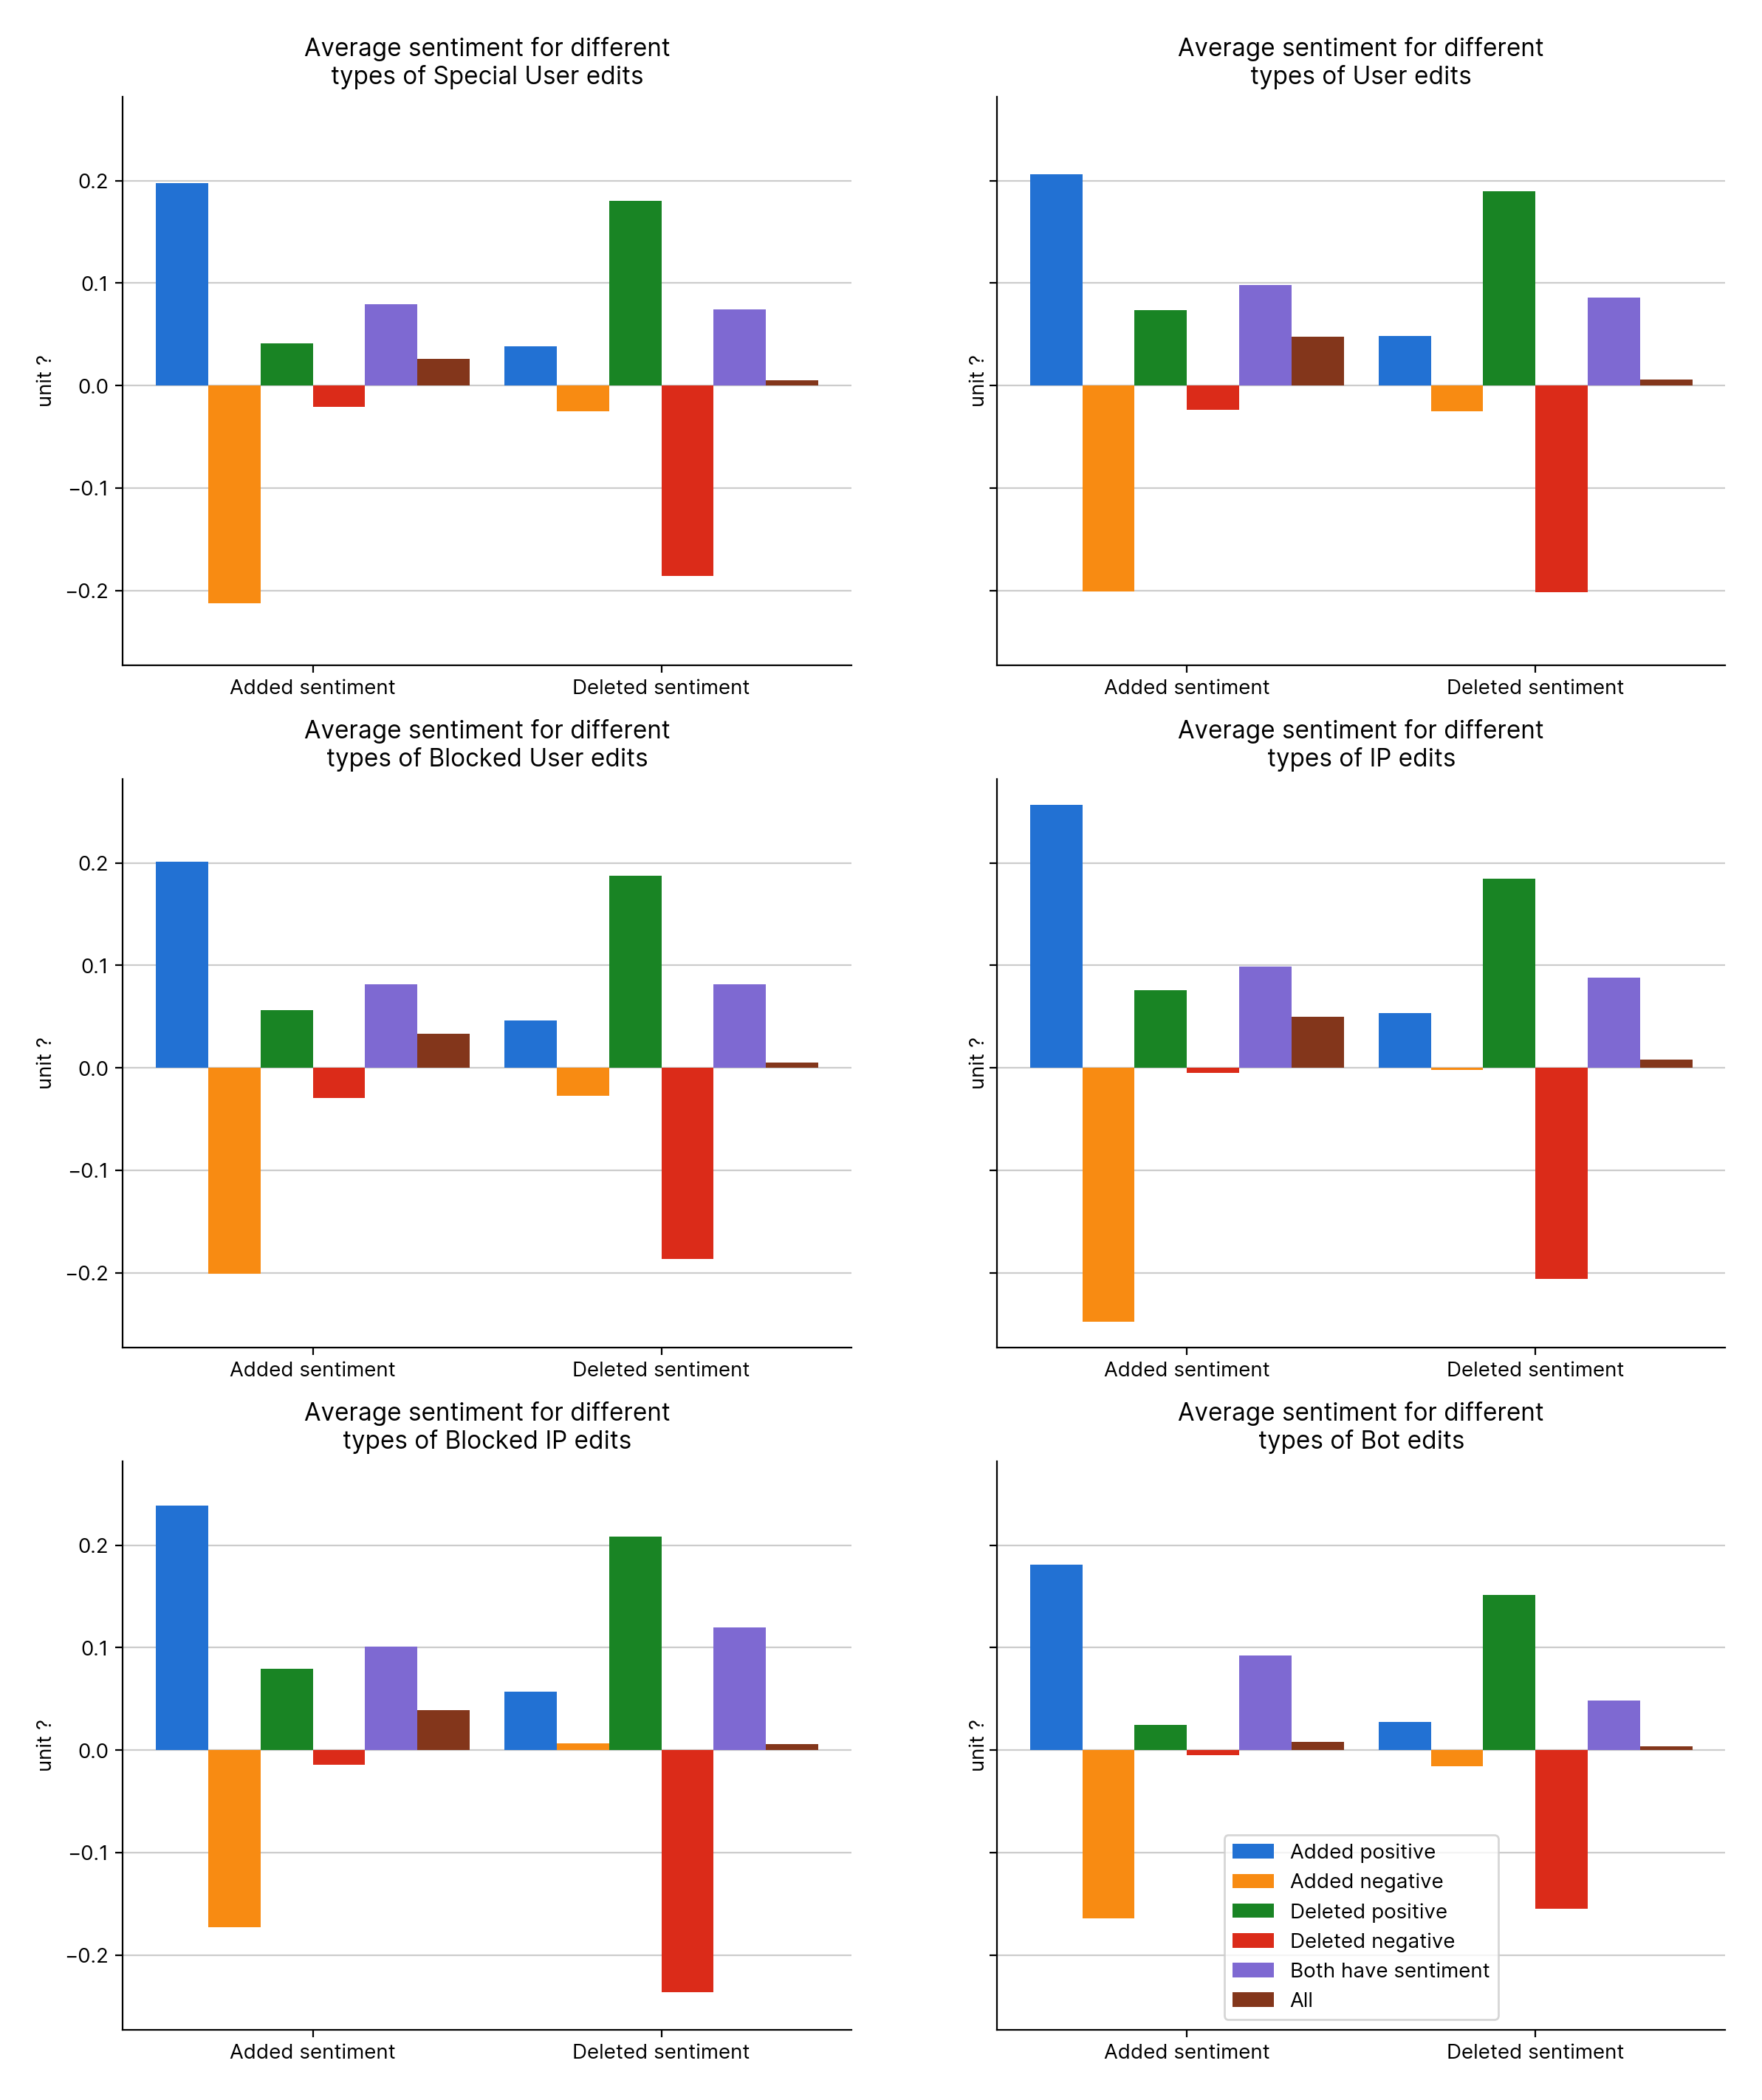
Figure 13.1
To investigate whether there was a bias on whether positive or negative content was added, I seperated edits from different groups into subsets where the content added/deleted was positive/negative. Additionally, only edits where both added and deleted had sentiment were considered. On average, when blocked IP users add negative content they also delete positive content.
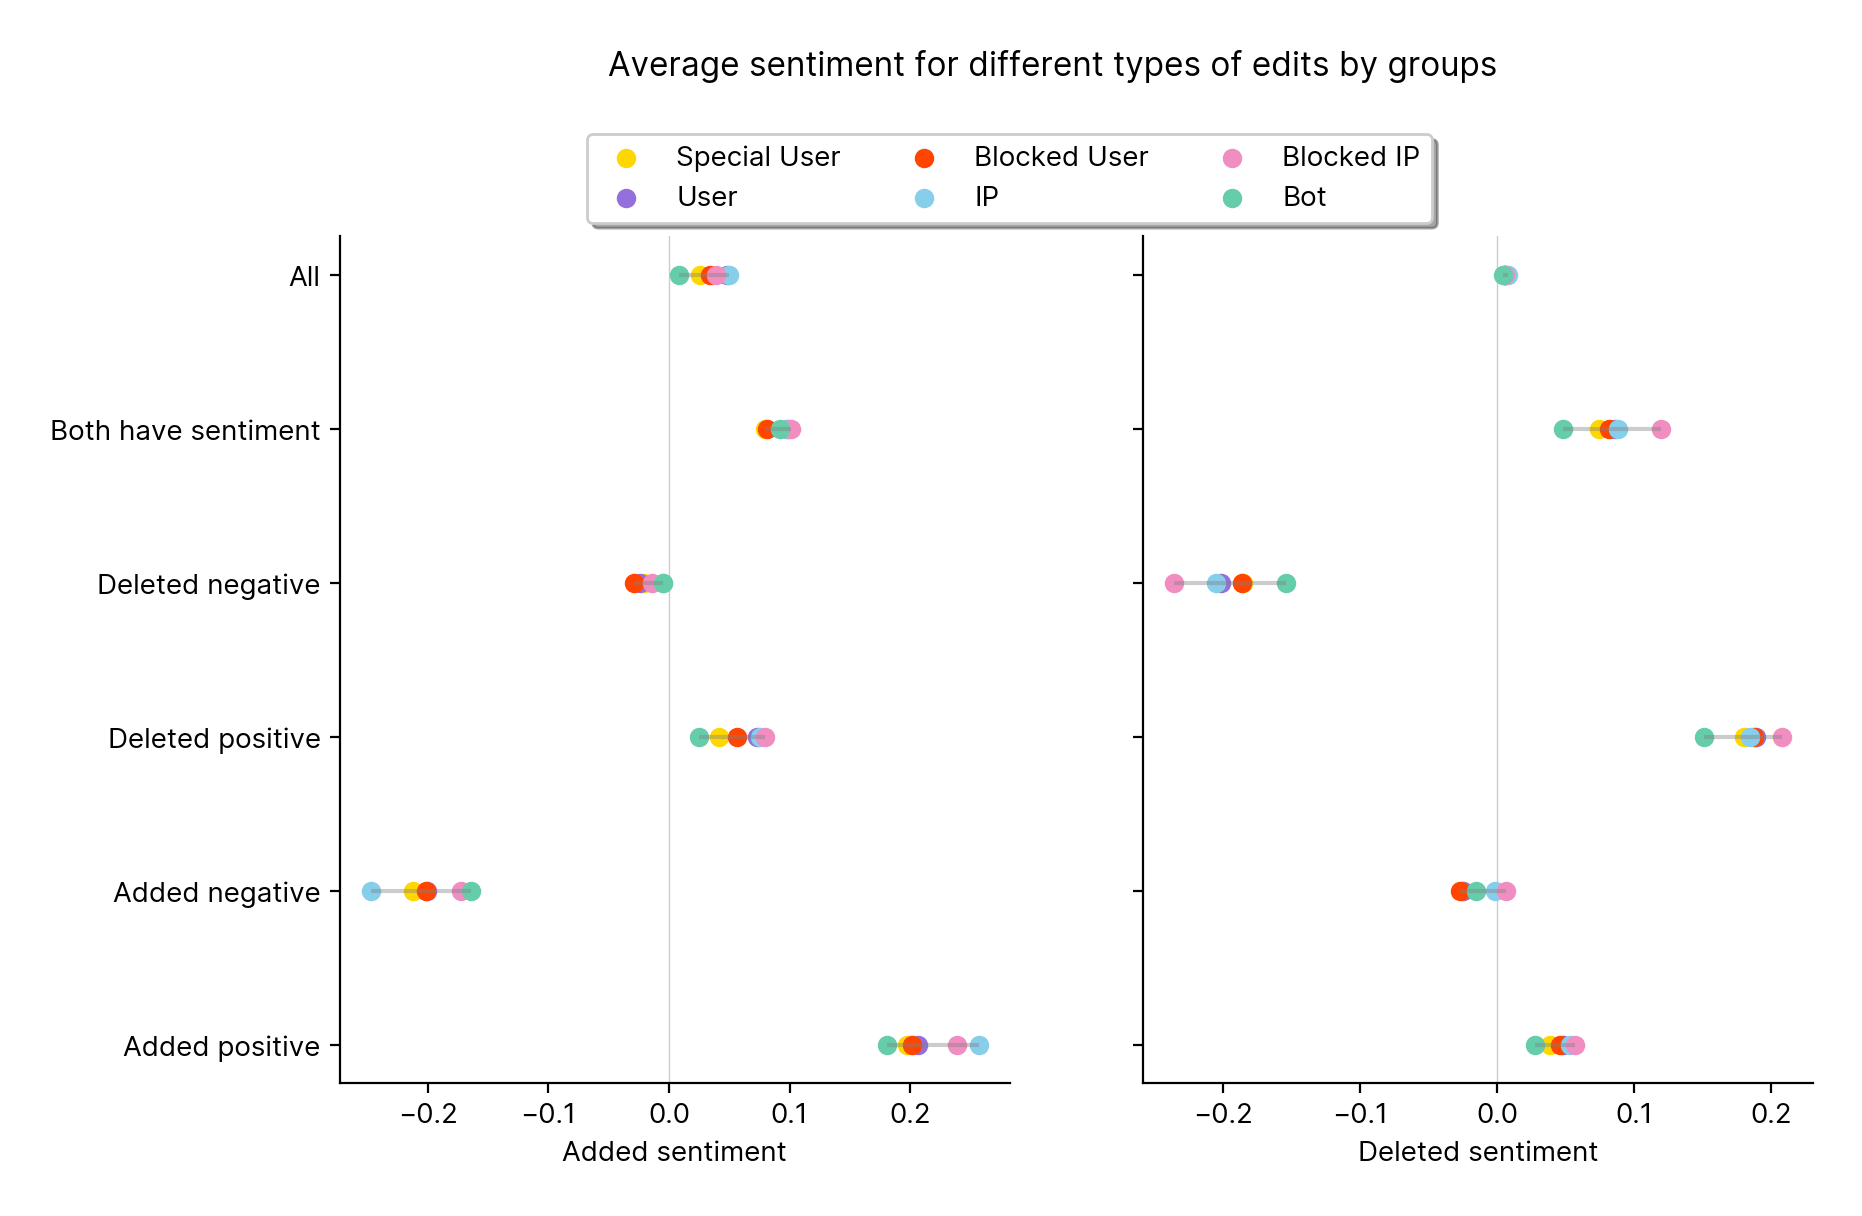
Figure 13.2
It’s clearer here that blocked IP’s are the only editors “cross the line”, signalling that they deleted the opposite sentiment on average to the other groups.
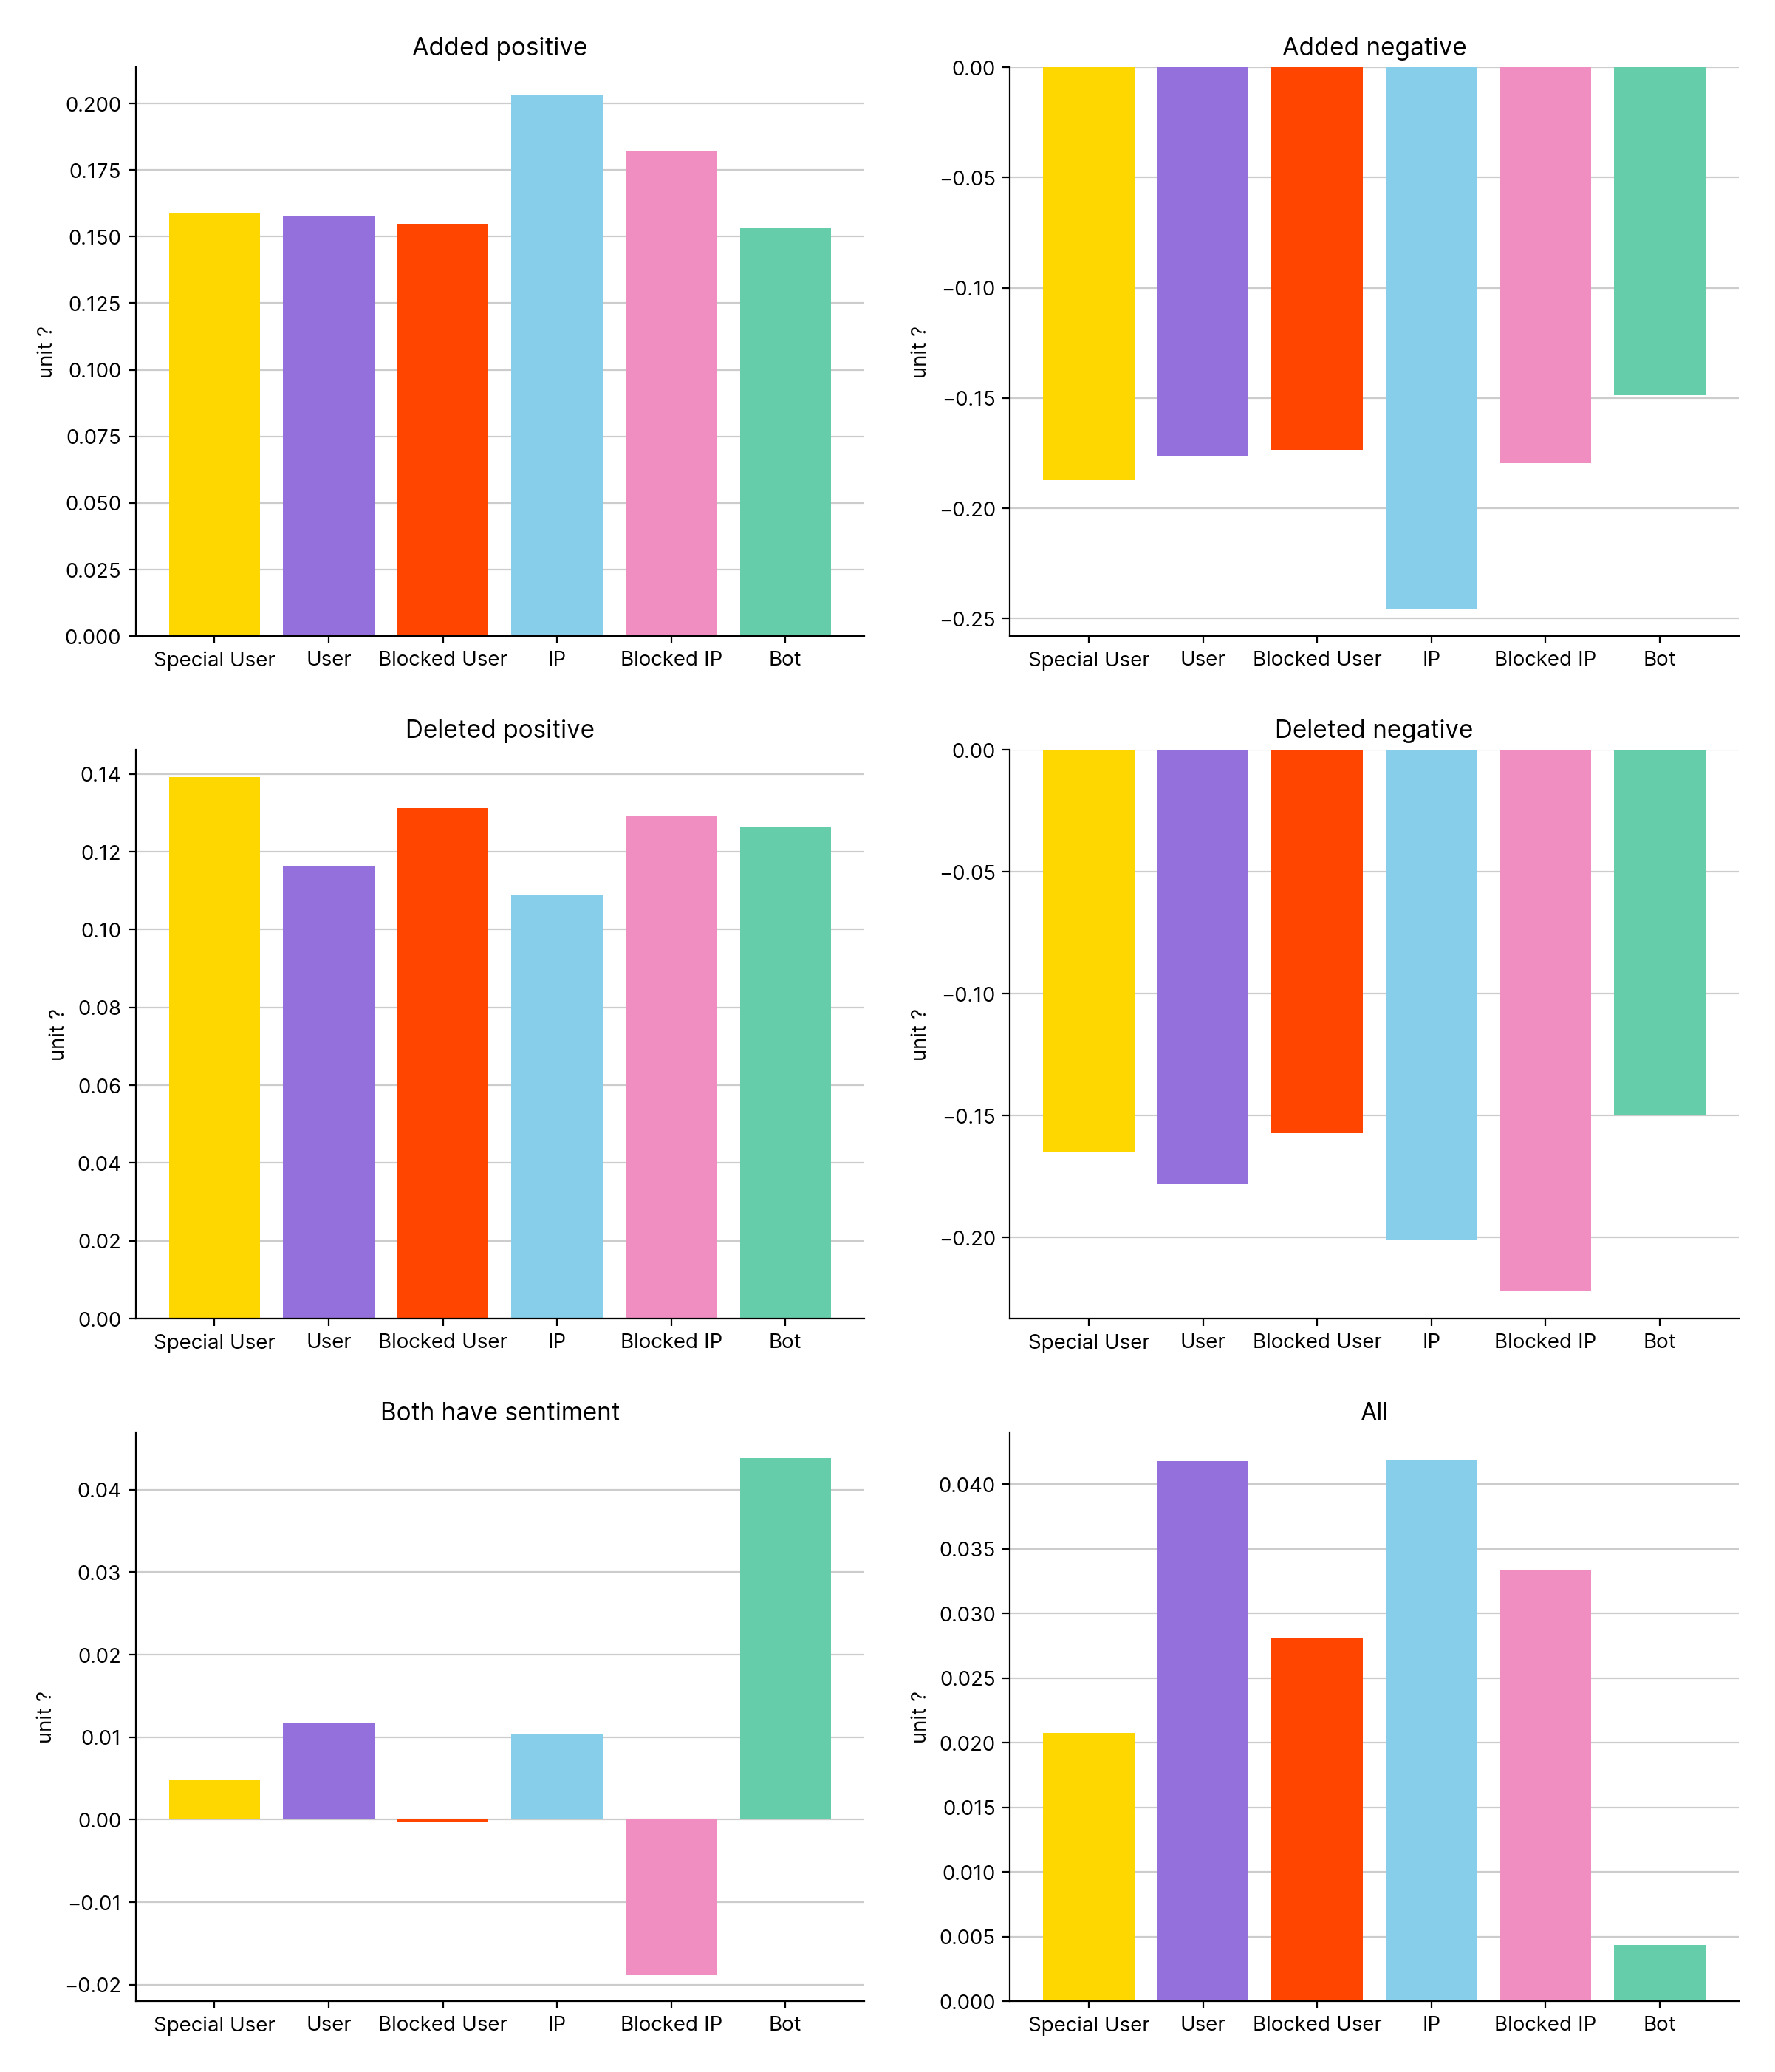
Figure 13.3
This plot is the total sentiment added and deleted from the page — i.e. for “Added Positive” it is the added sentiment minus the deleted sentiment — this allows us to see which groups have the largest affect on talkpage sentiment with their edits.
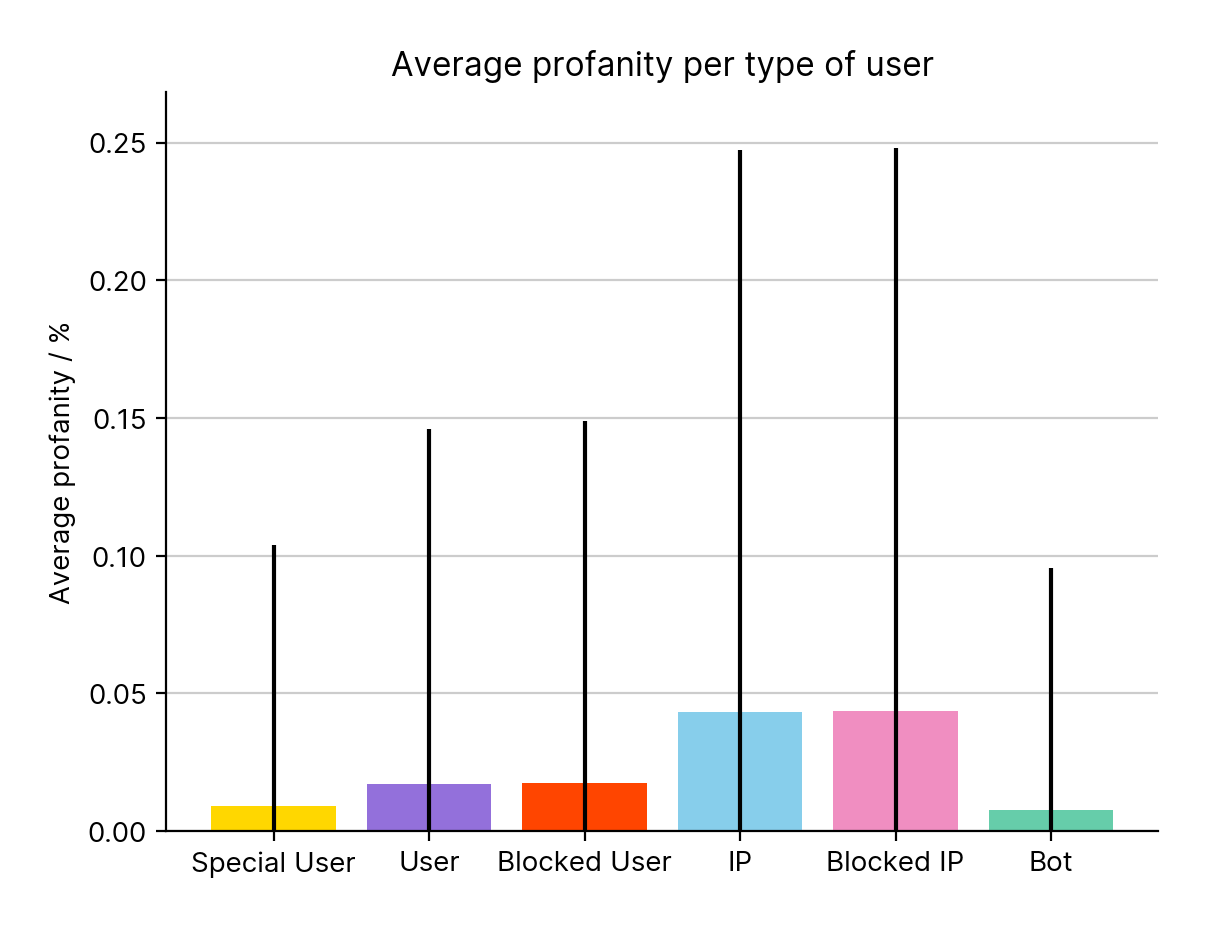
Figure 14
IPs use similar amounts of profanity whether they are blocked or not.
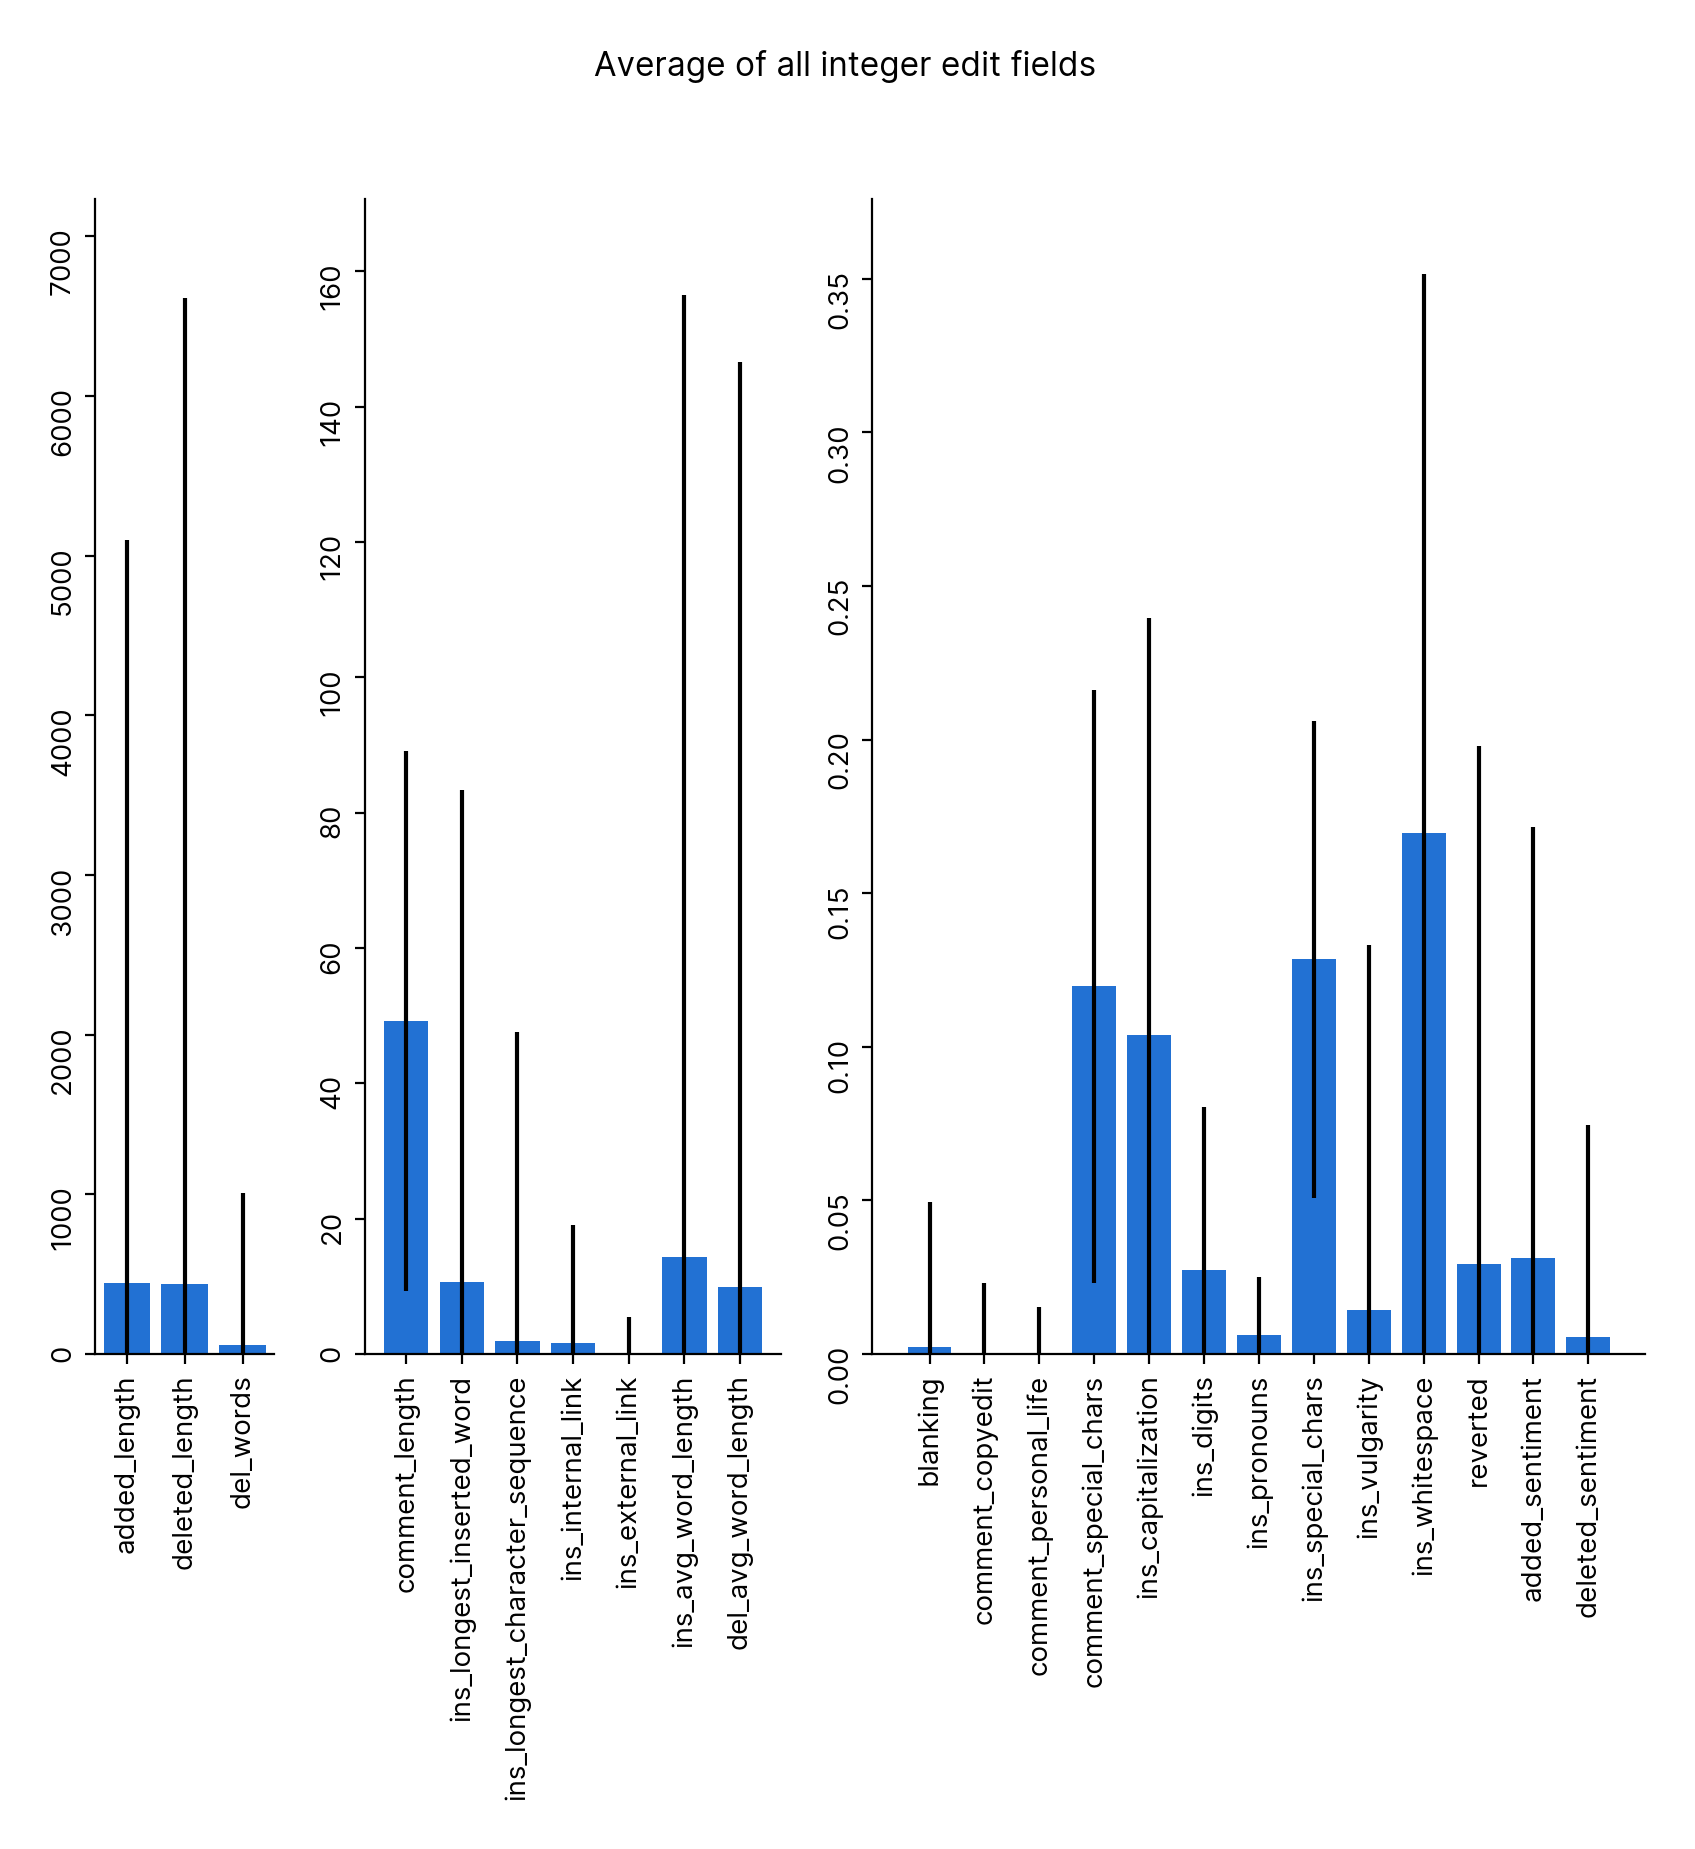
Figure 15
This shows the average value for all edit fields with error bars.
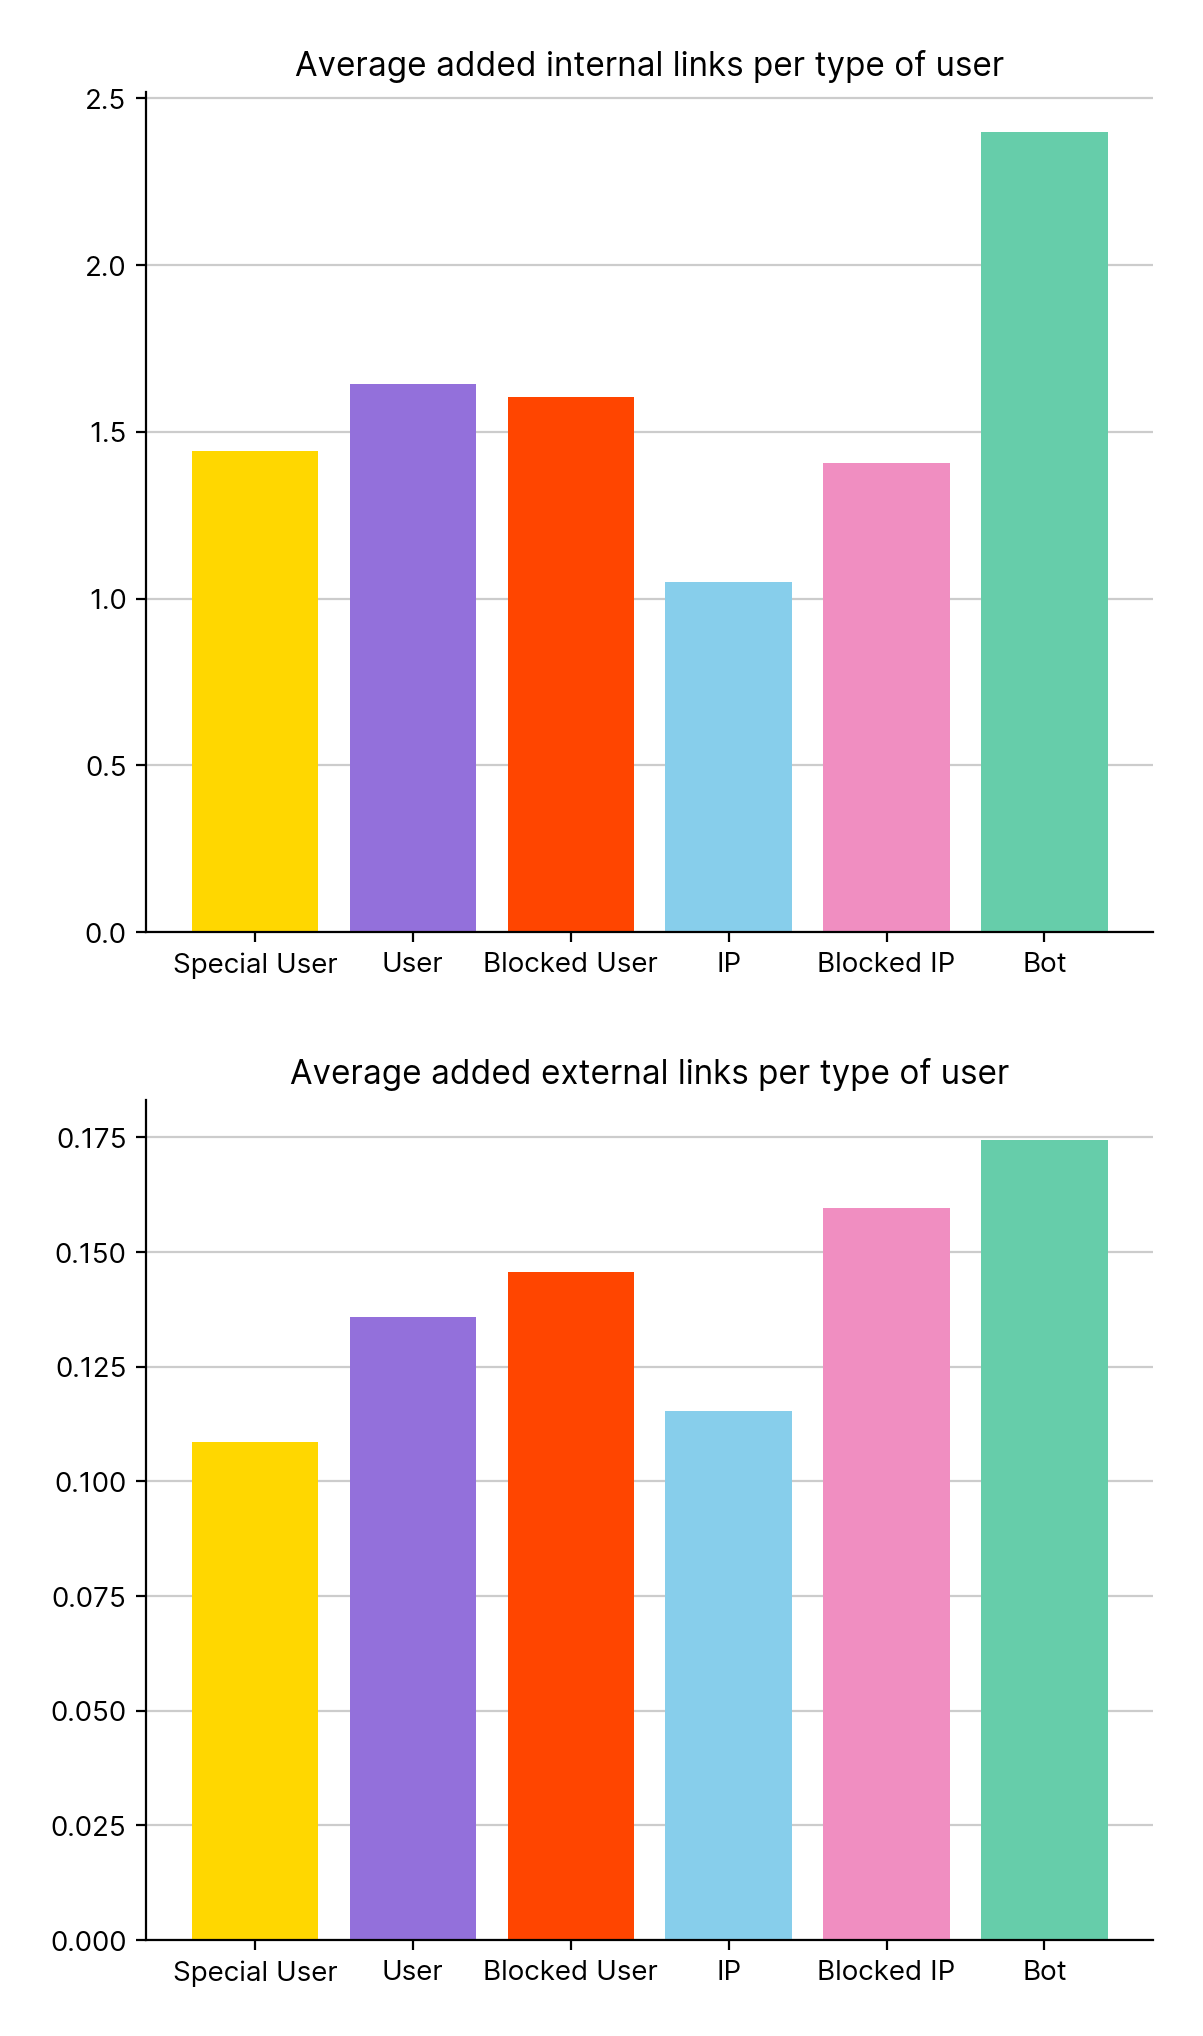
Figure 17
The average inserted internal links must be at least 1 as every comment is automatically inserted with a link to their user page if they don’t sign their comment. I expected users with special privileges to insert far more links.
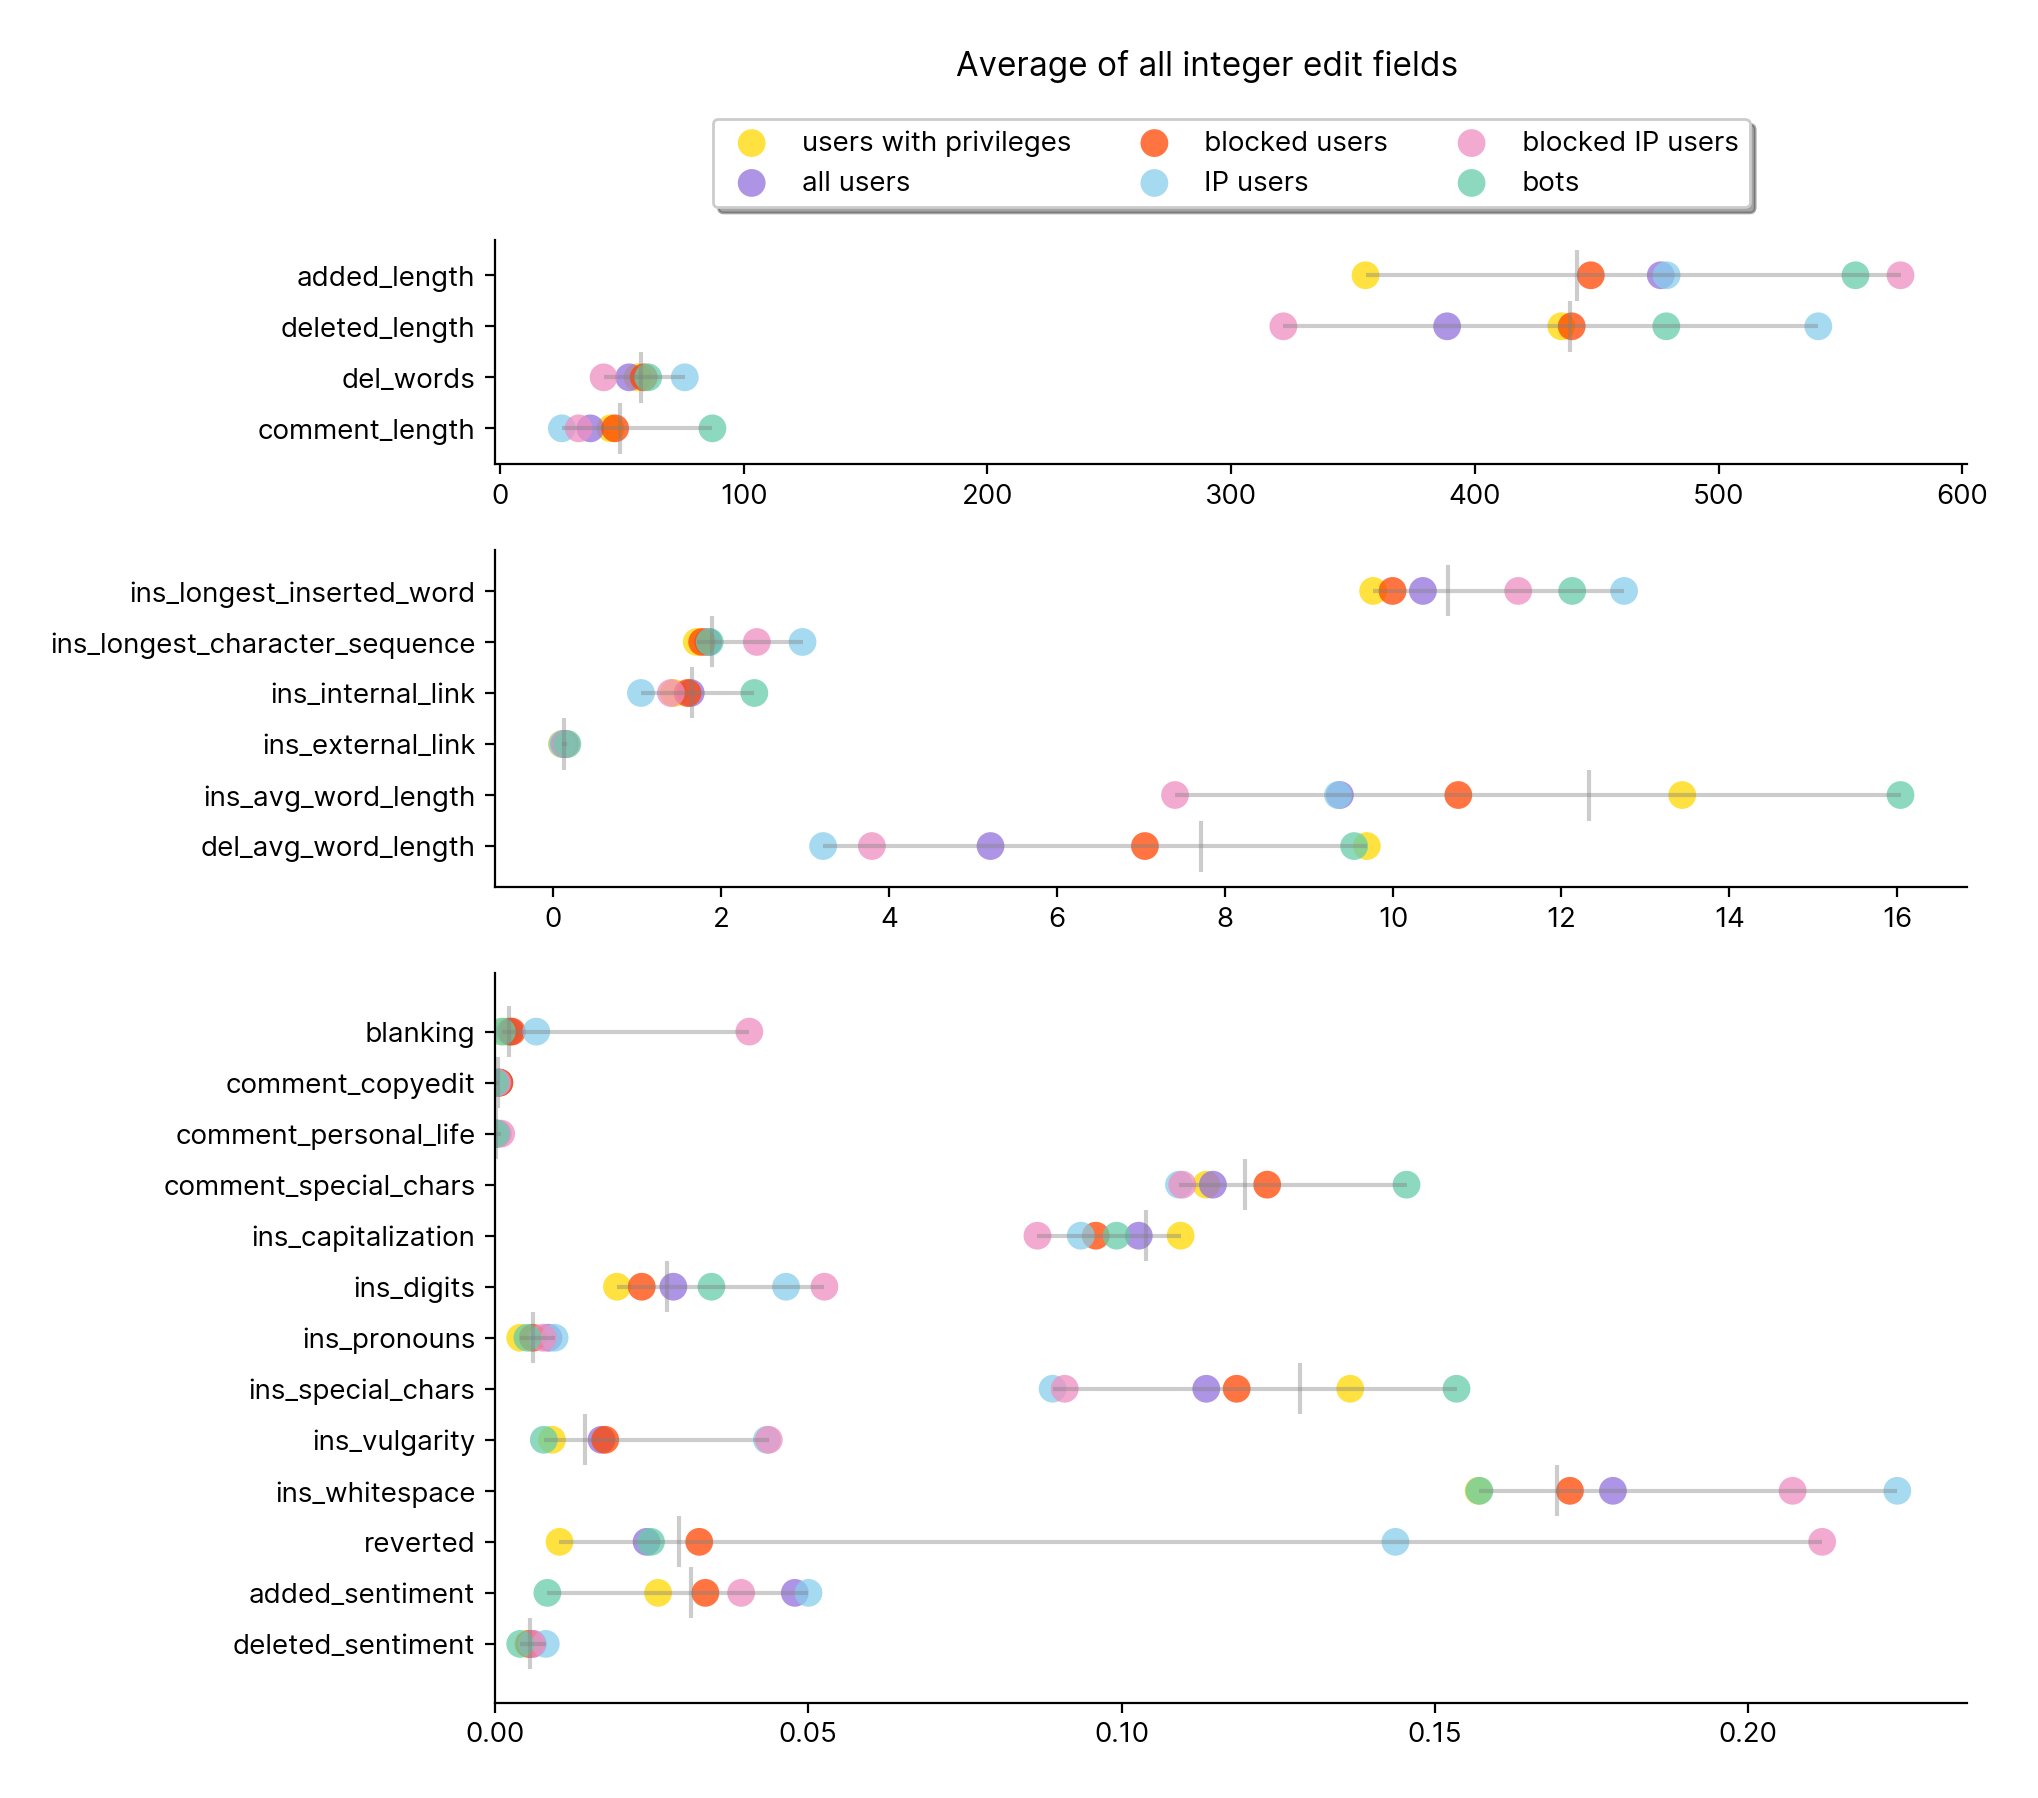
Figure 19
It’s clear that edits that we think of as spammy — high vulgarity, high reversions, blanking (removing pages) - are performed by blocked IPs and not blocked users. Blocked IPs also delete the least but add the most, think copy and pasting lots of random text. Special users suprisingly don’t appear on any extremes other than they are reverted the least. The vertical bars are the average of all users.
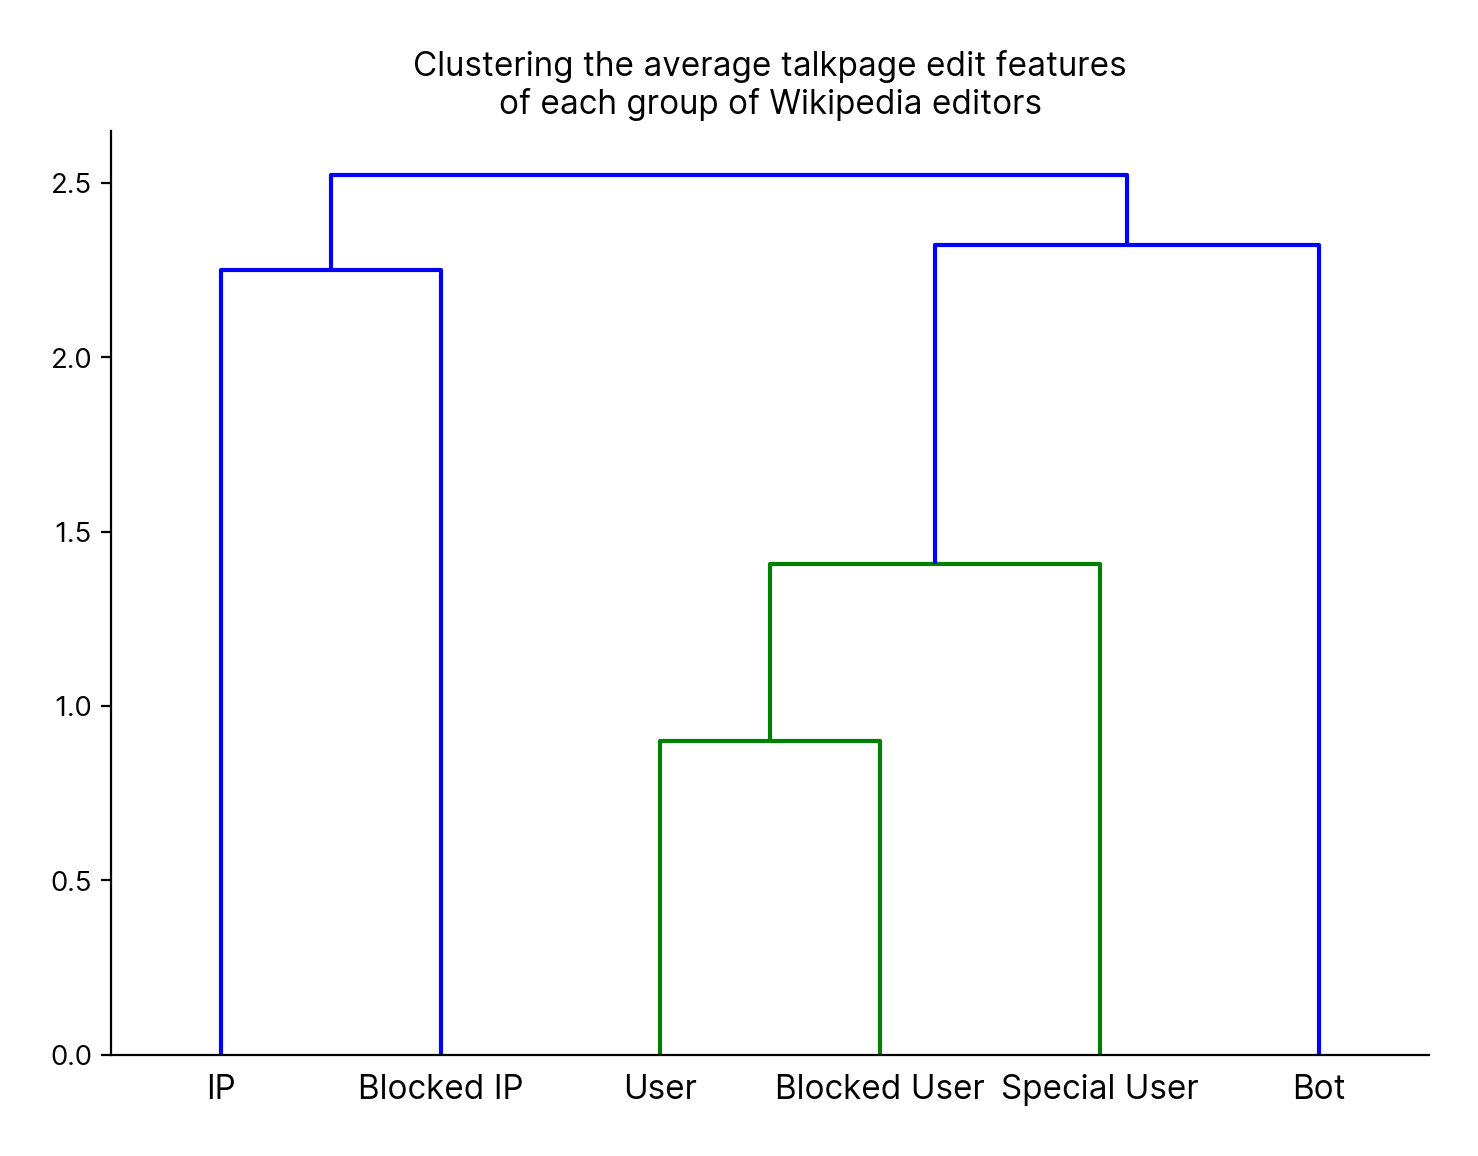
Figure 41
A dendrogram created from the features from the previous plot
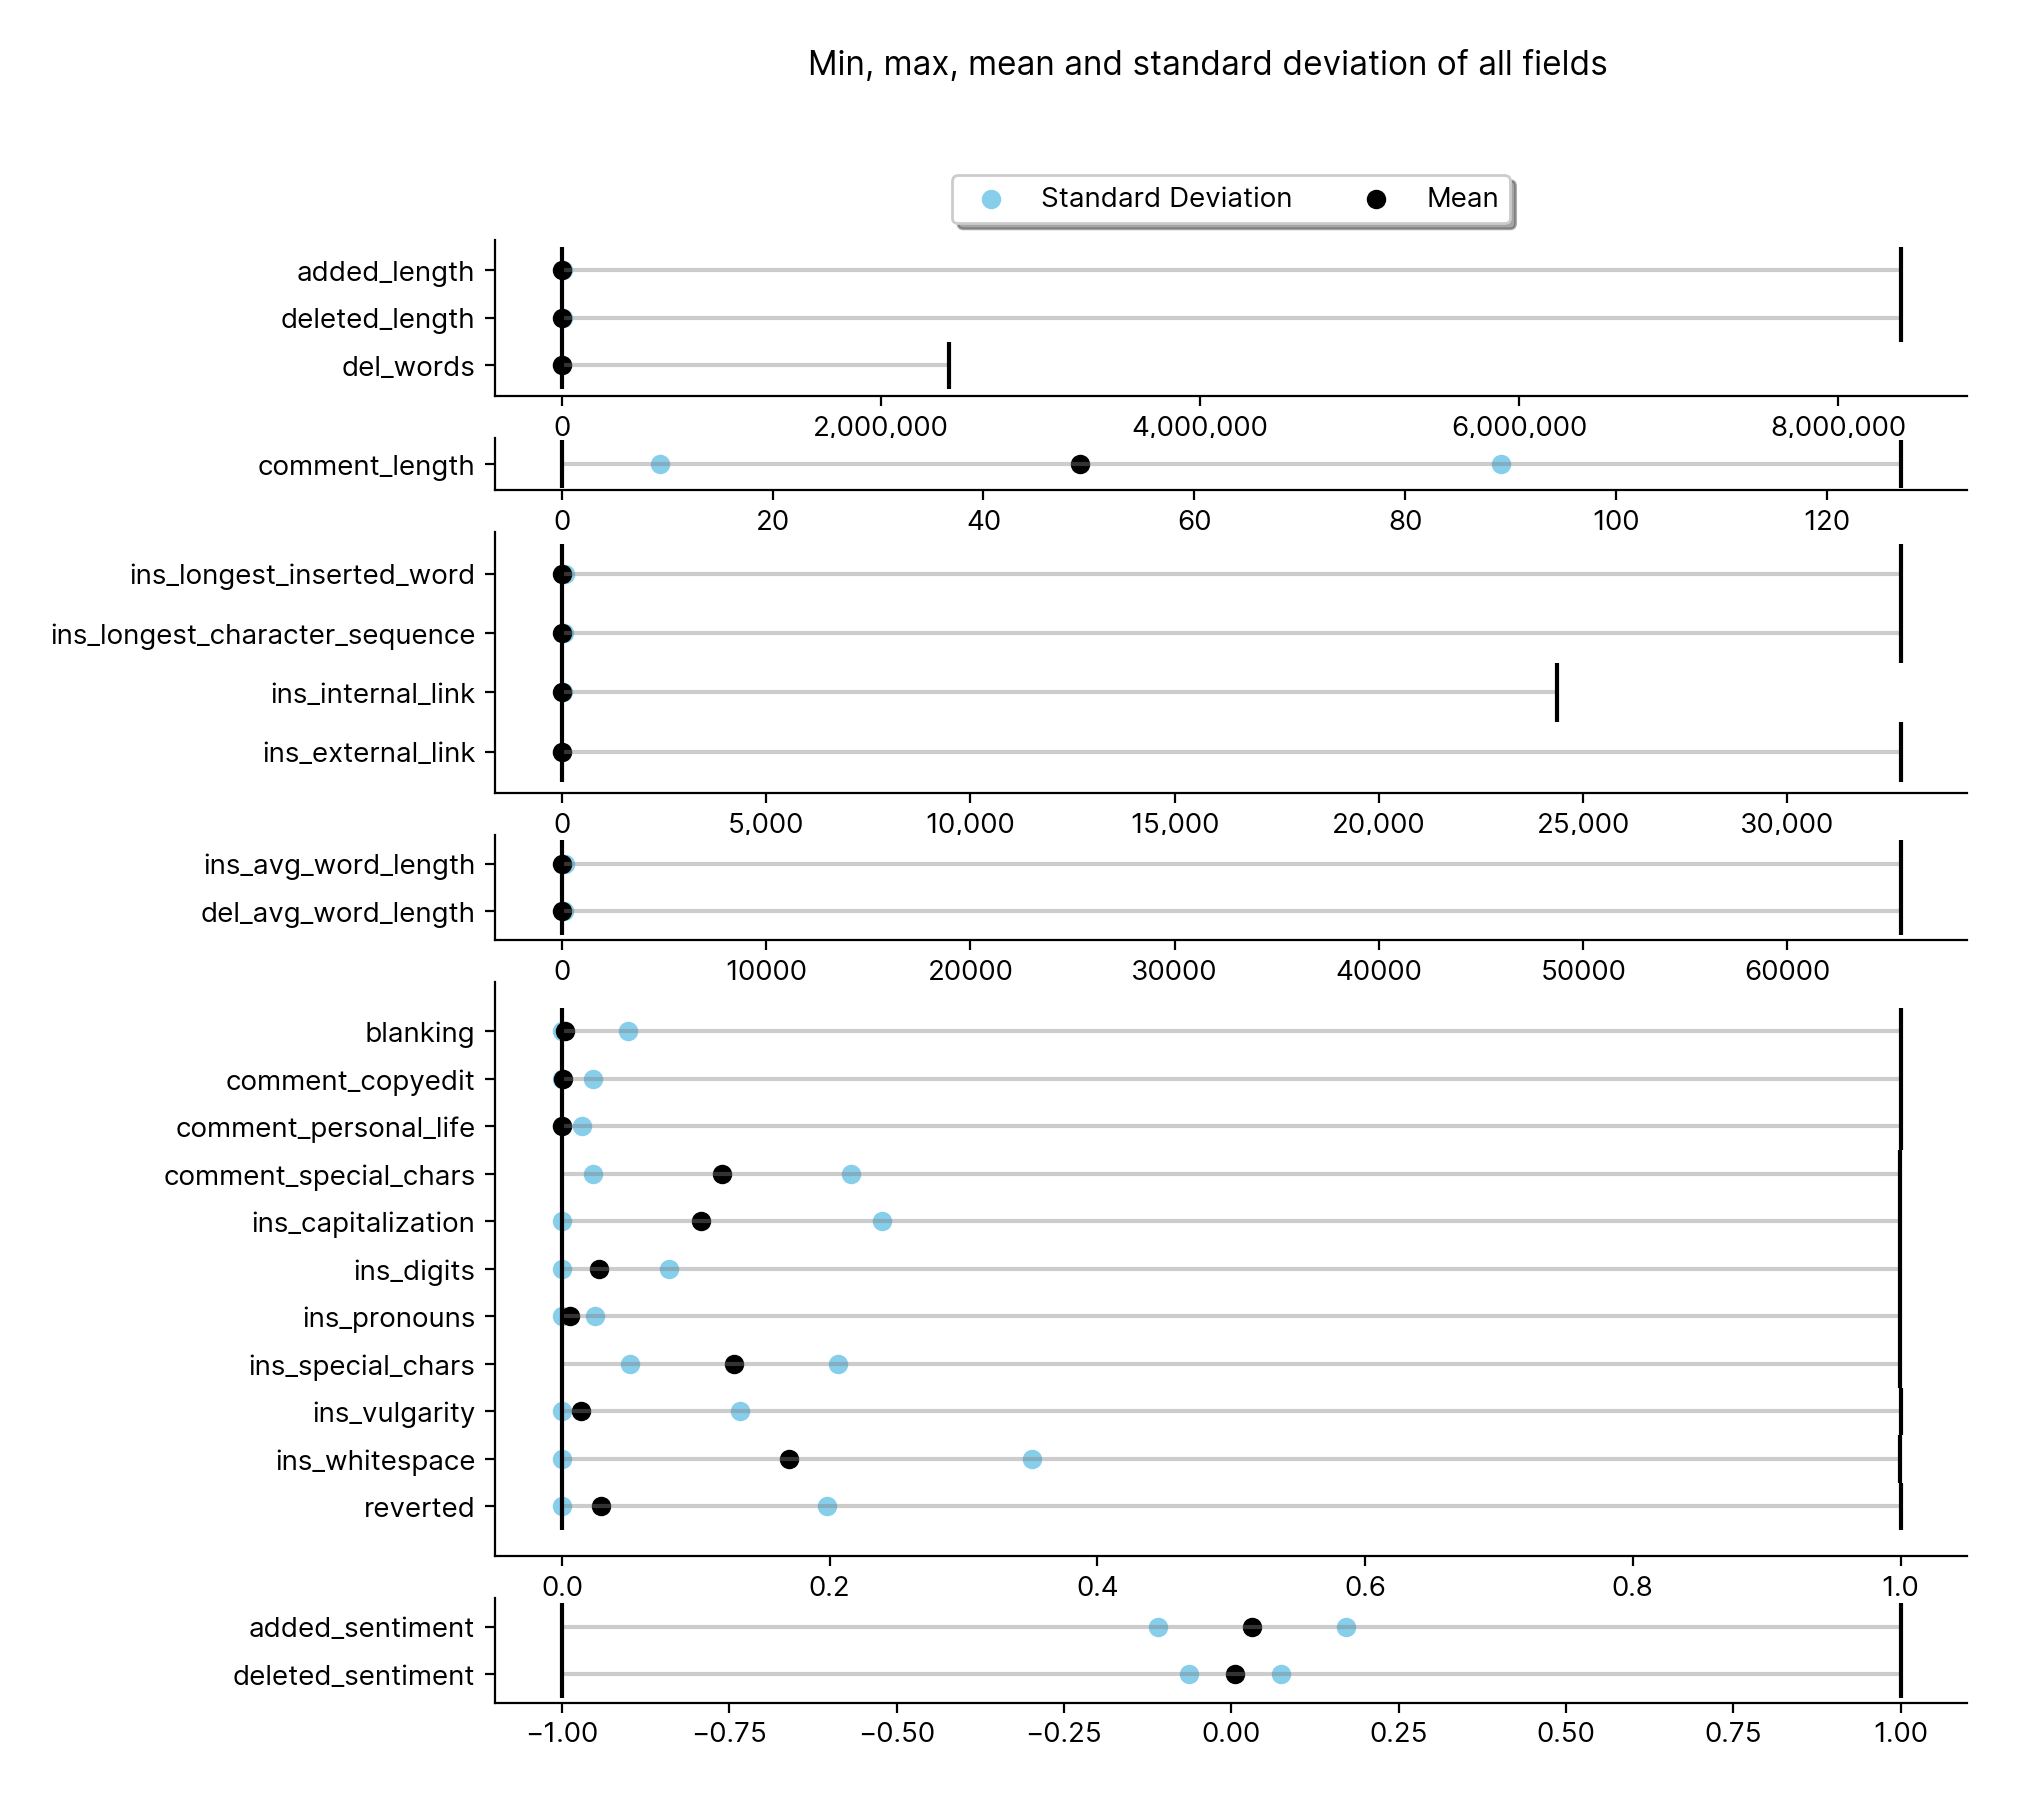
Figure 22
Showing the range of all the integer values. Sentiment is constrained into a very tight range, suggesting people aren’t usually emotive in talkpage edits.
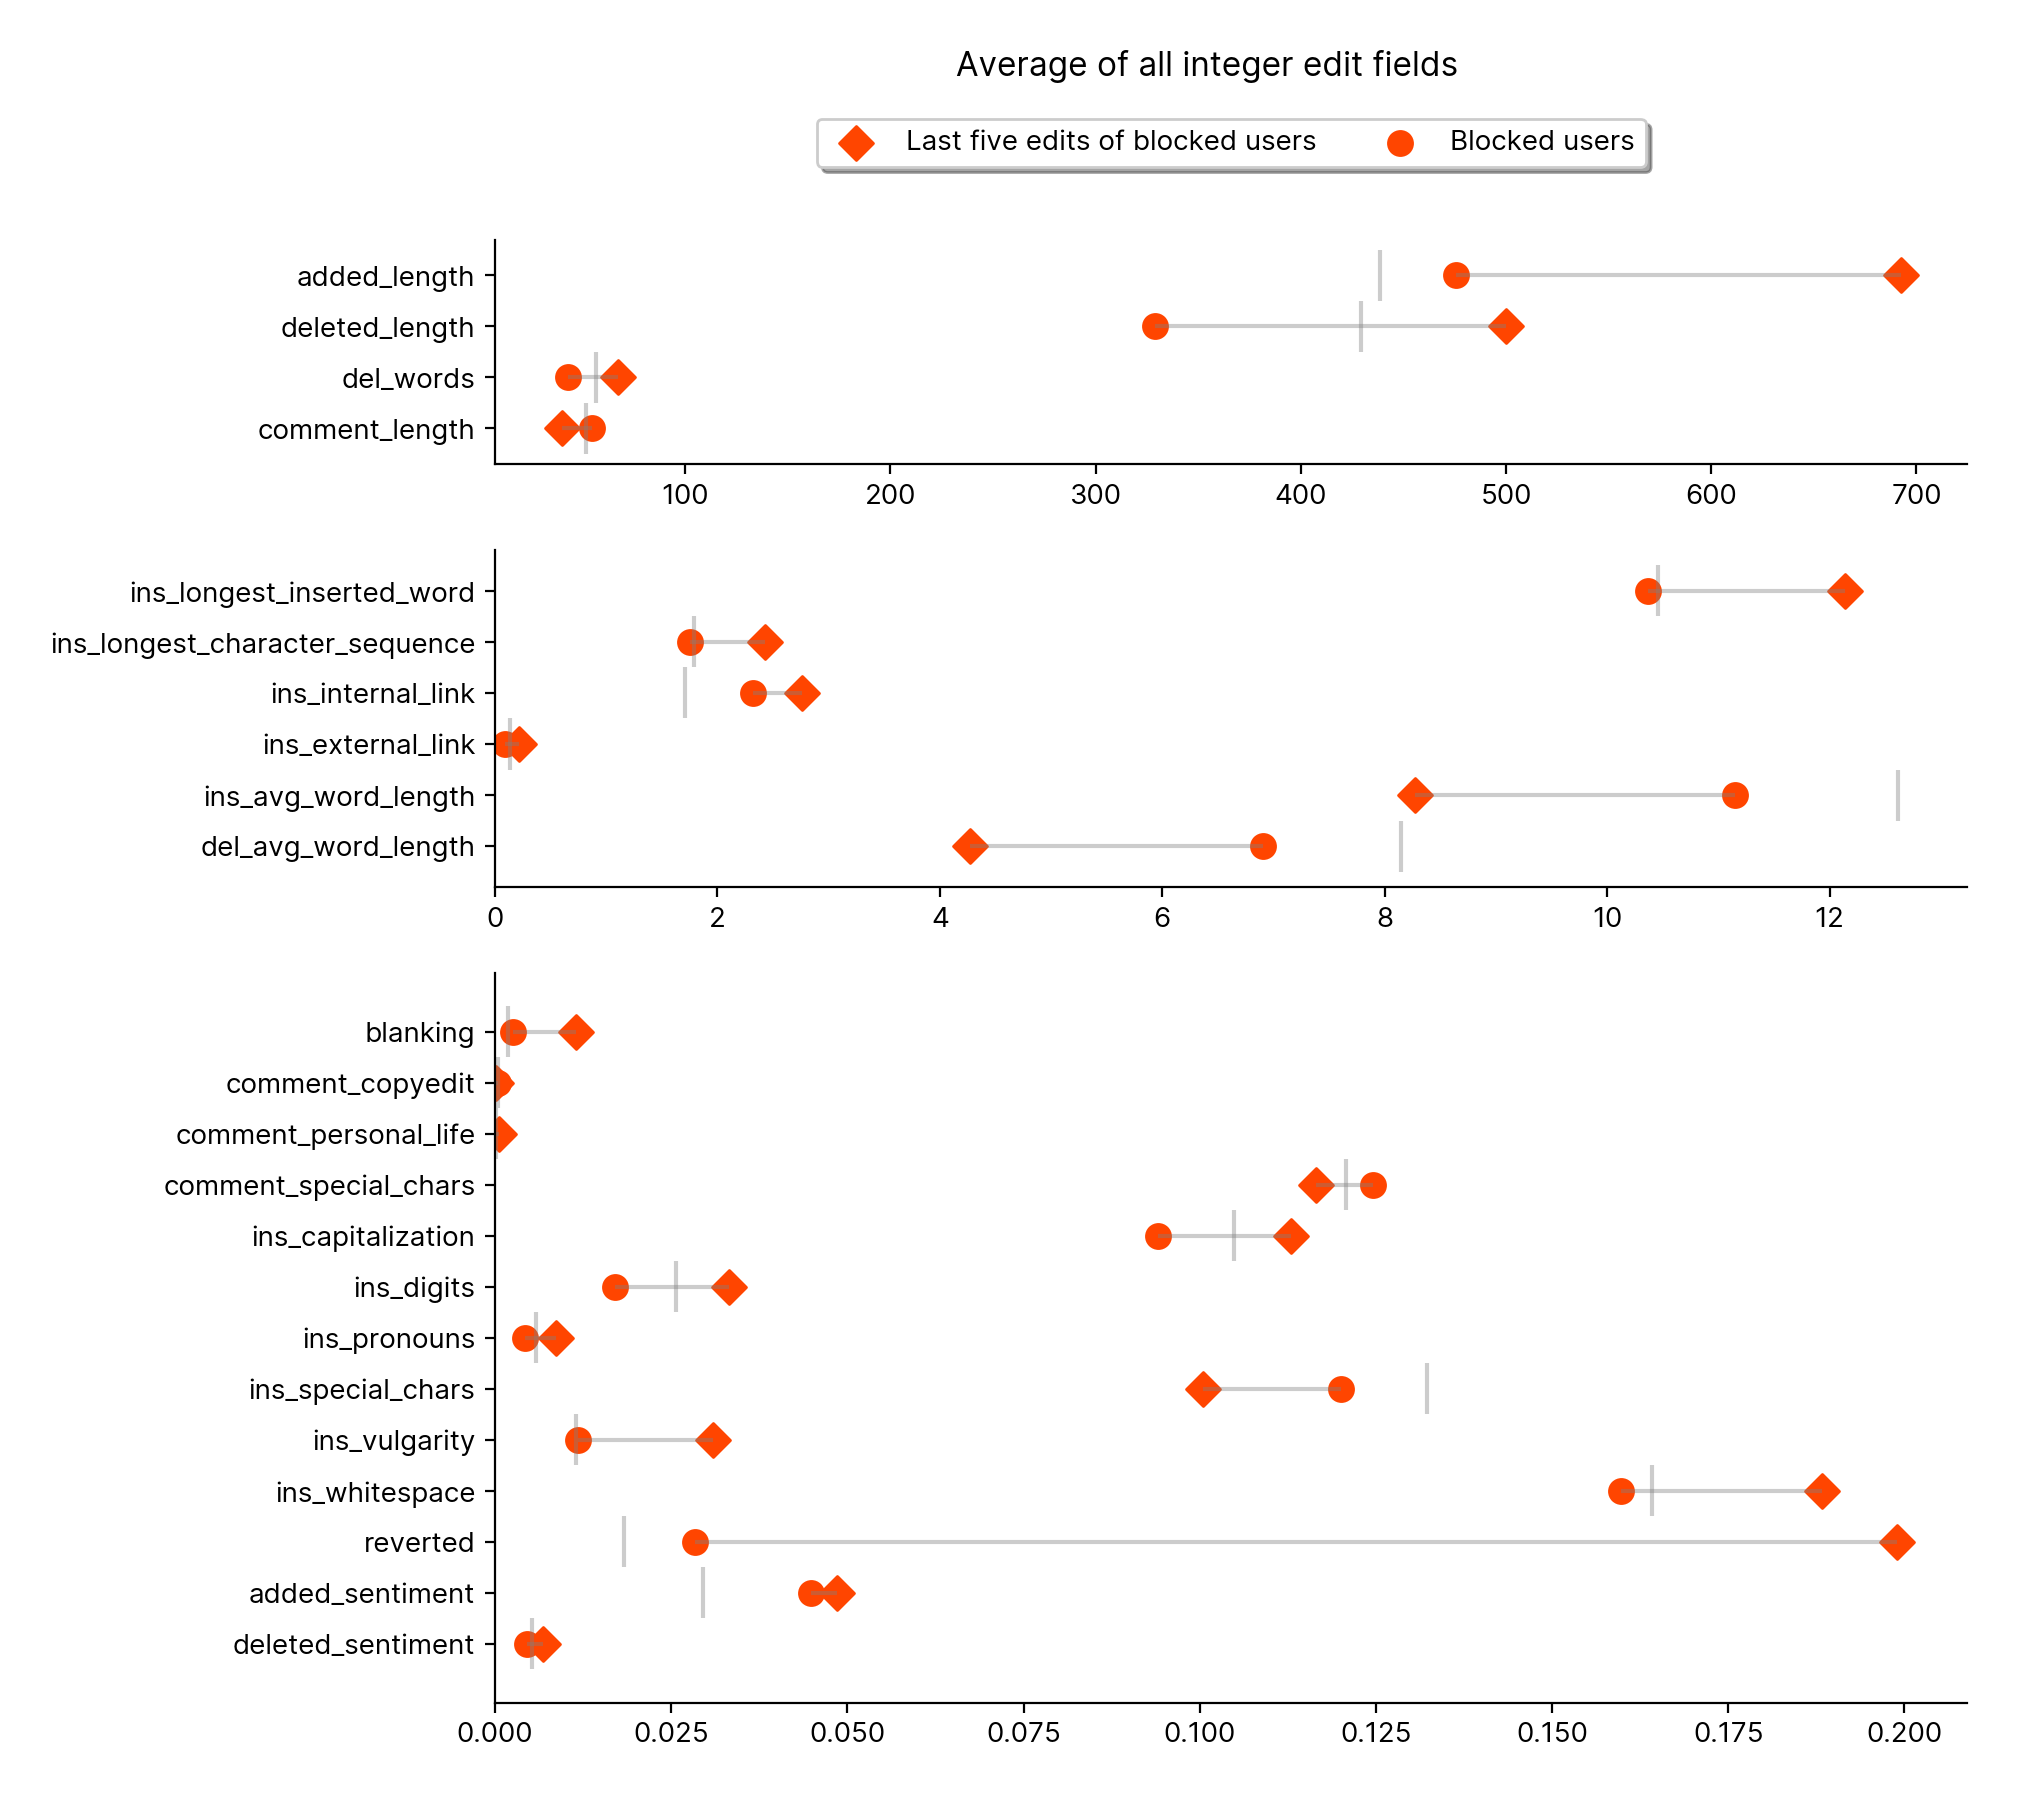
Figure 32.1
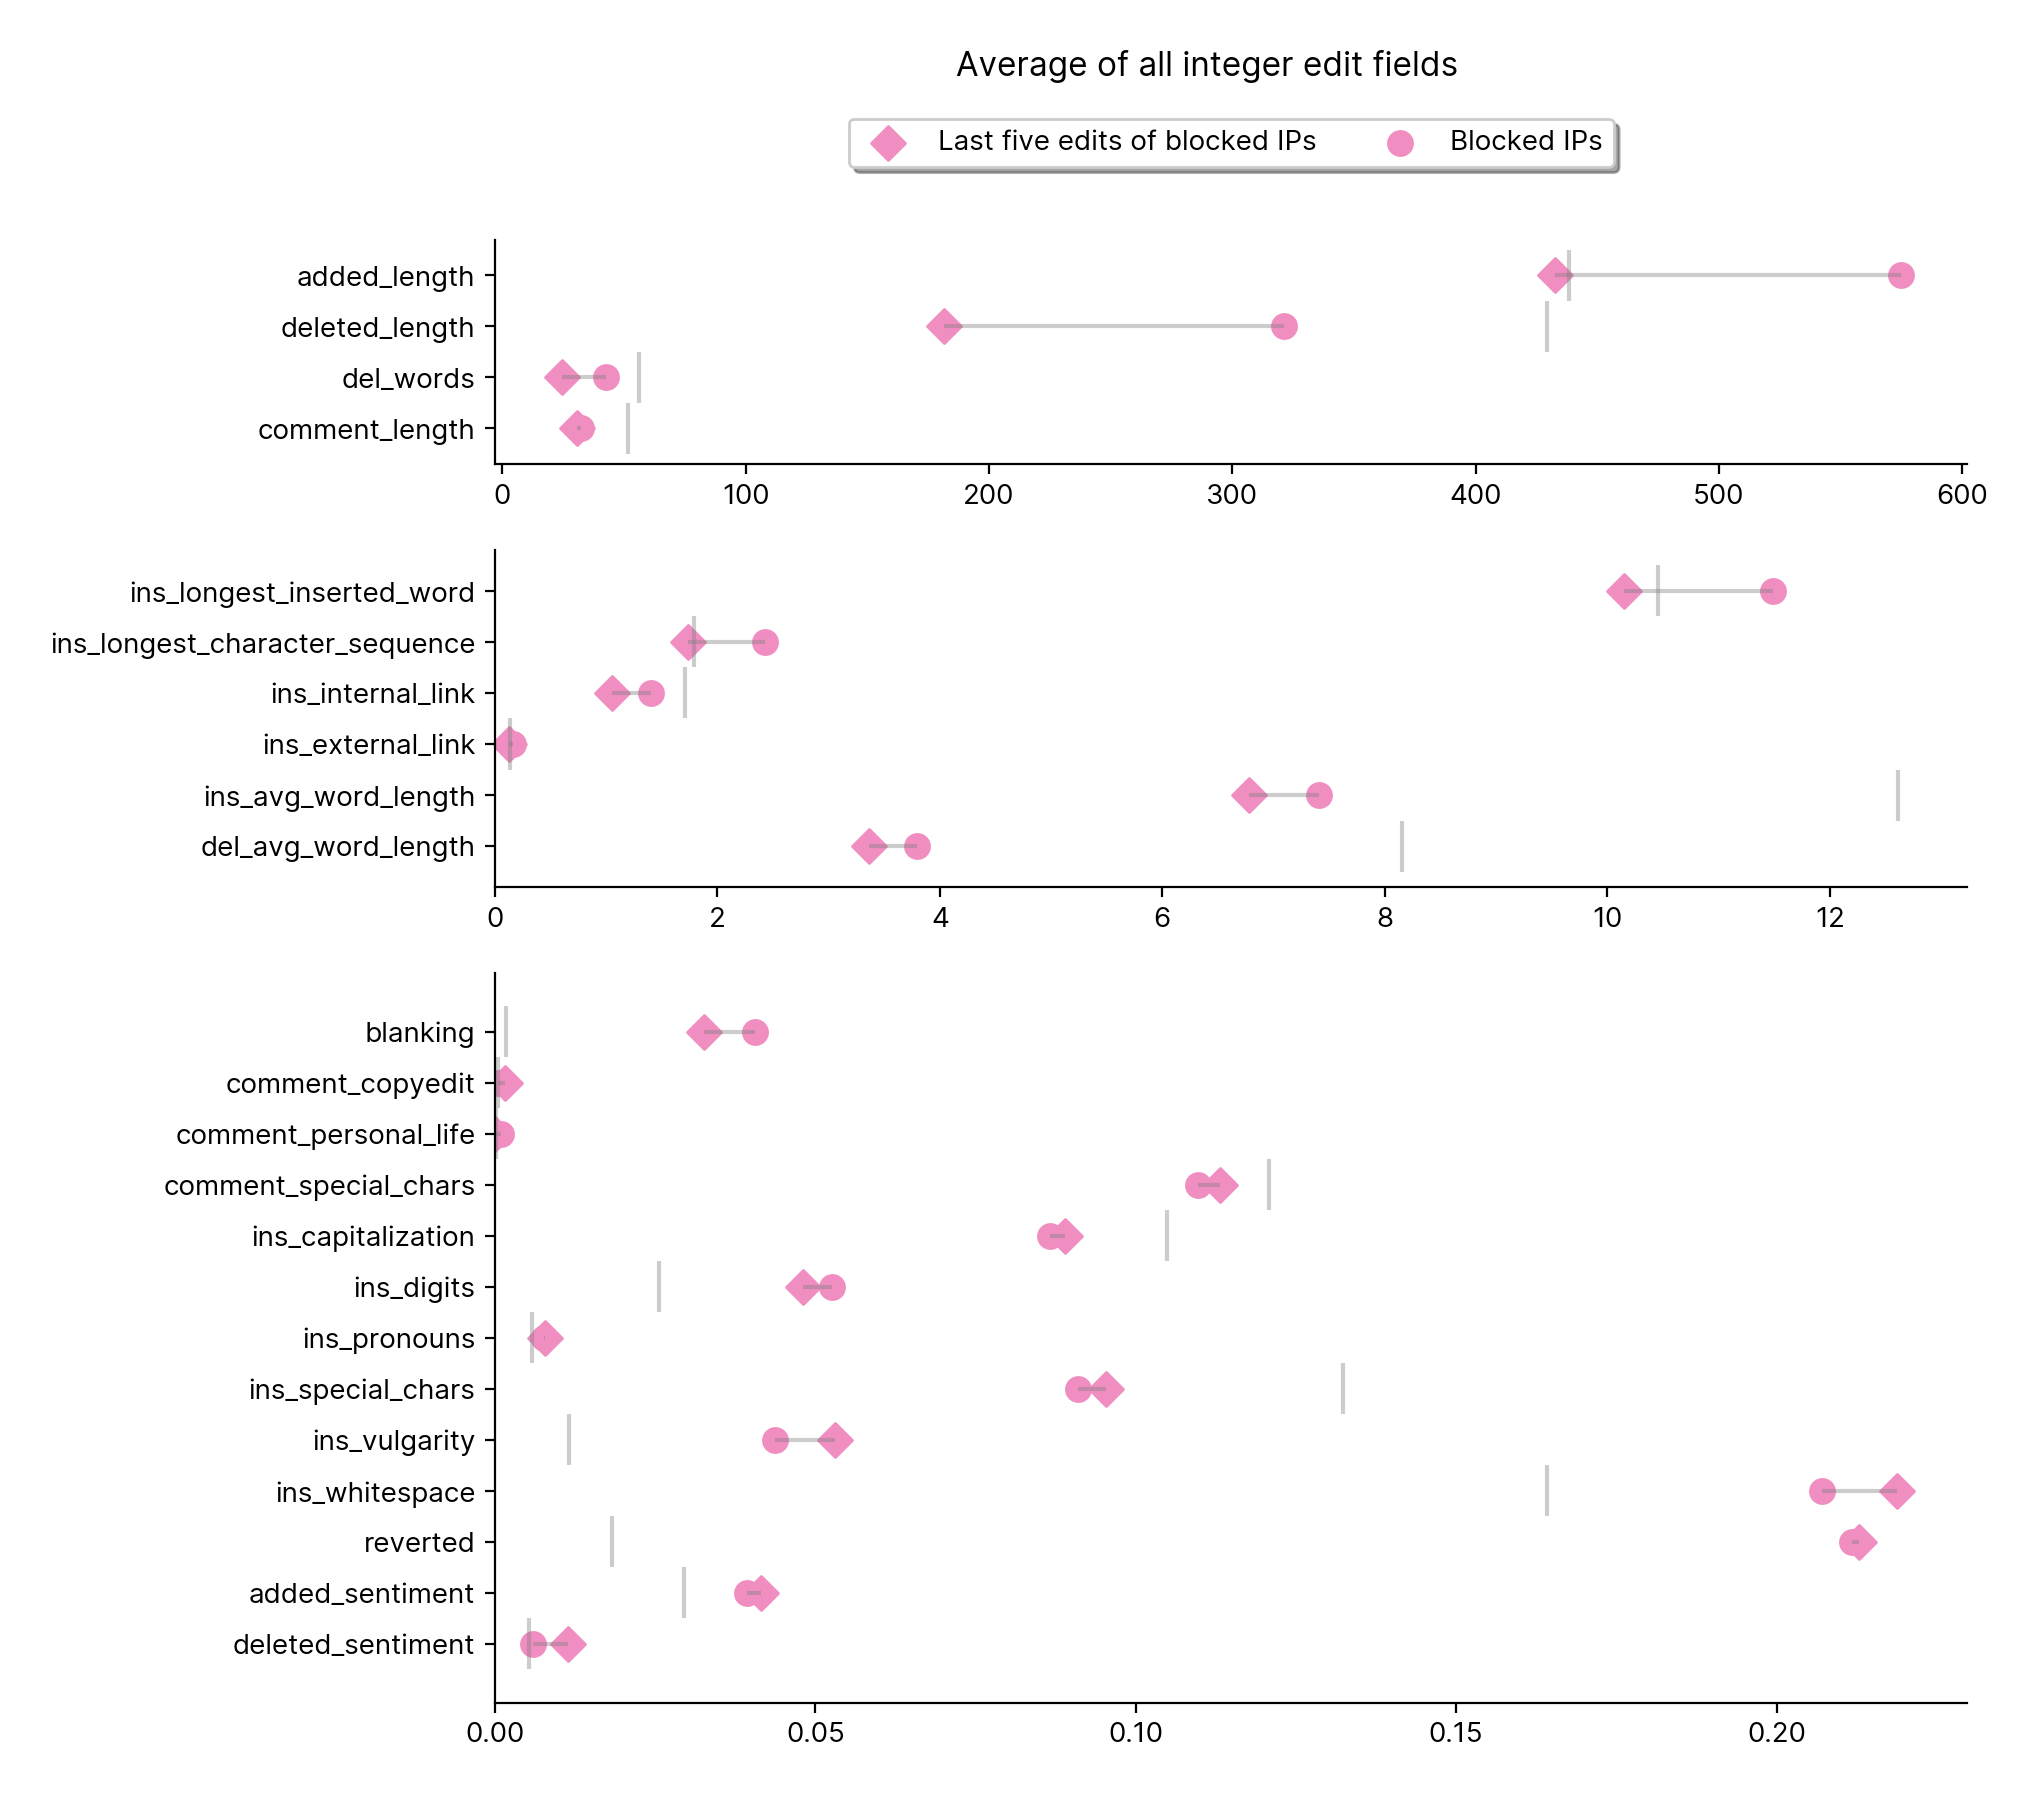
Figure 32.2
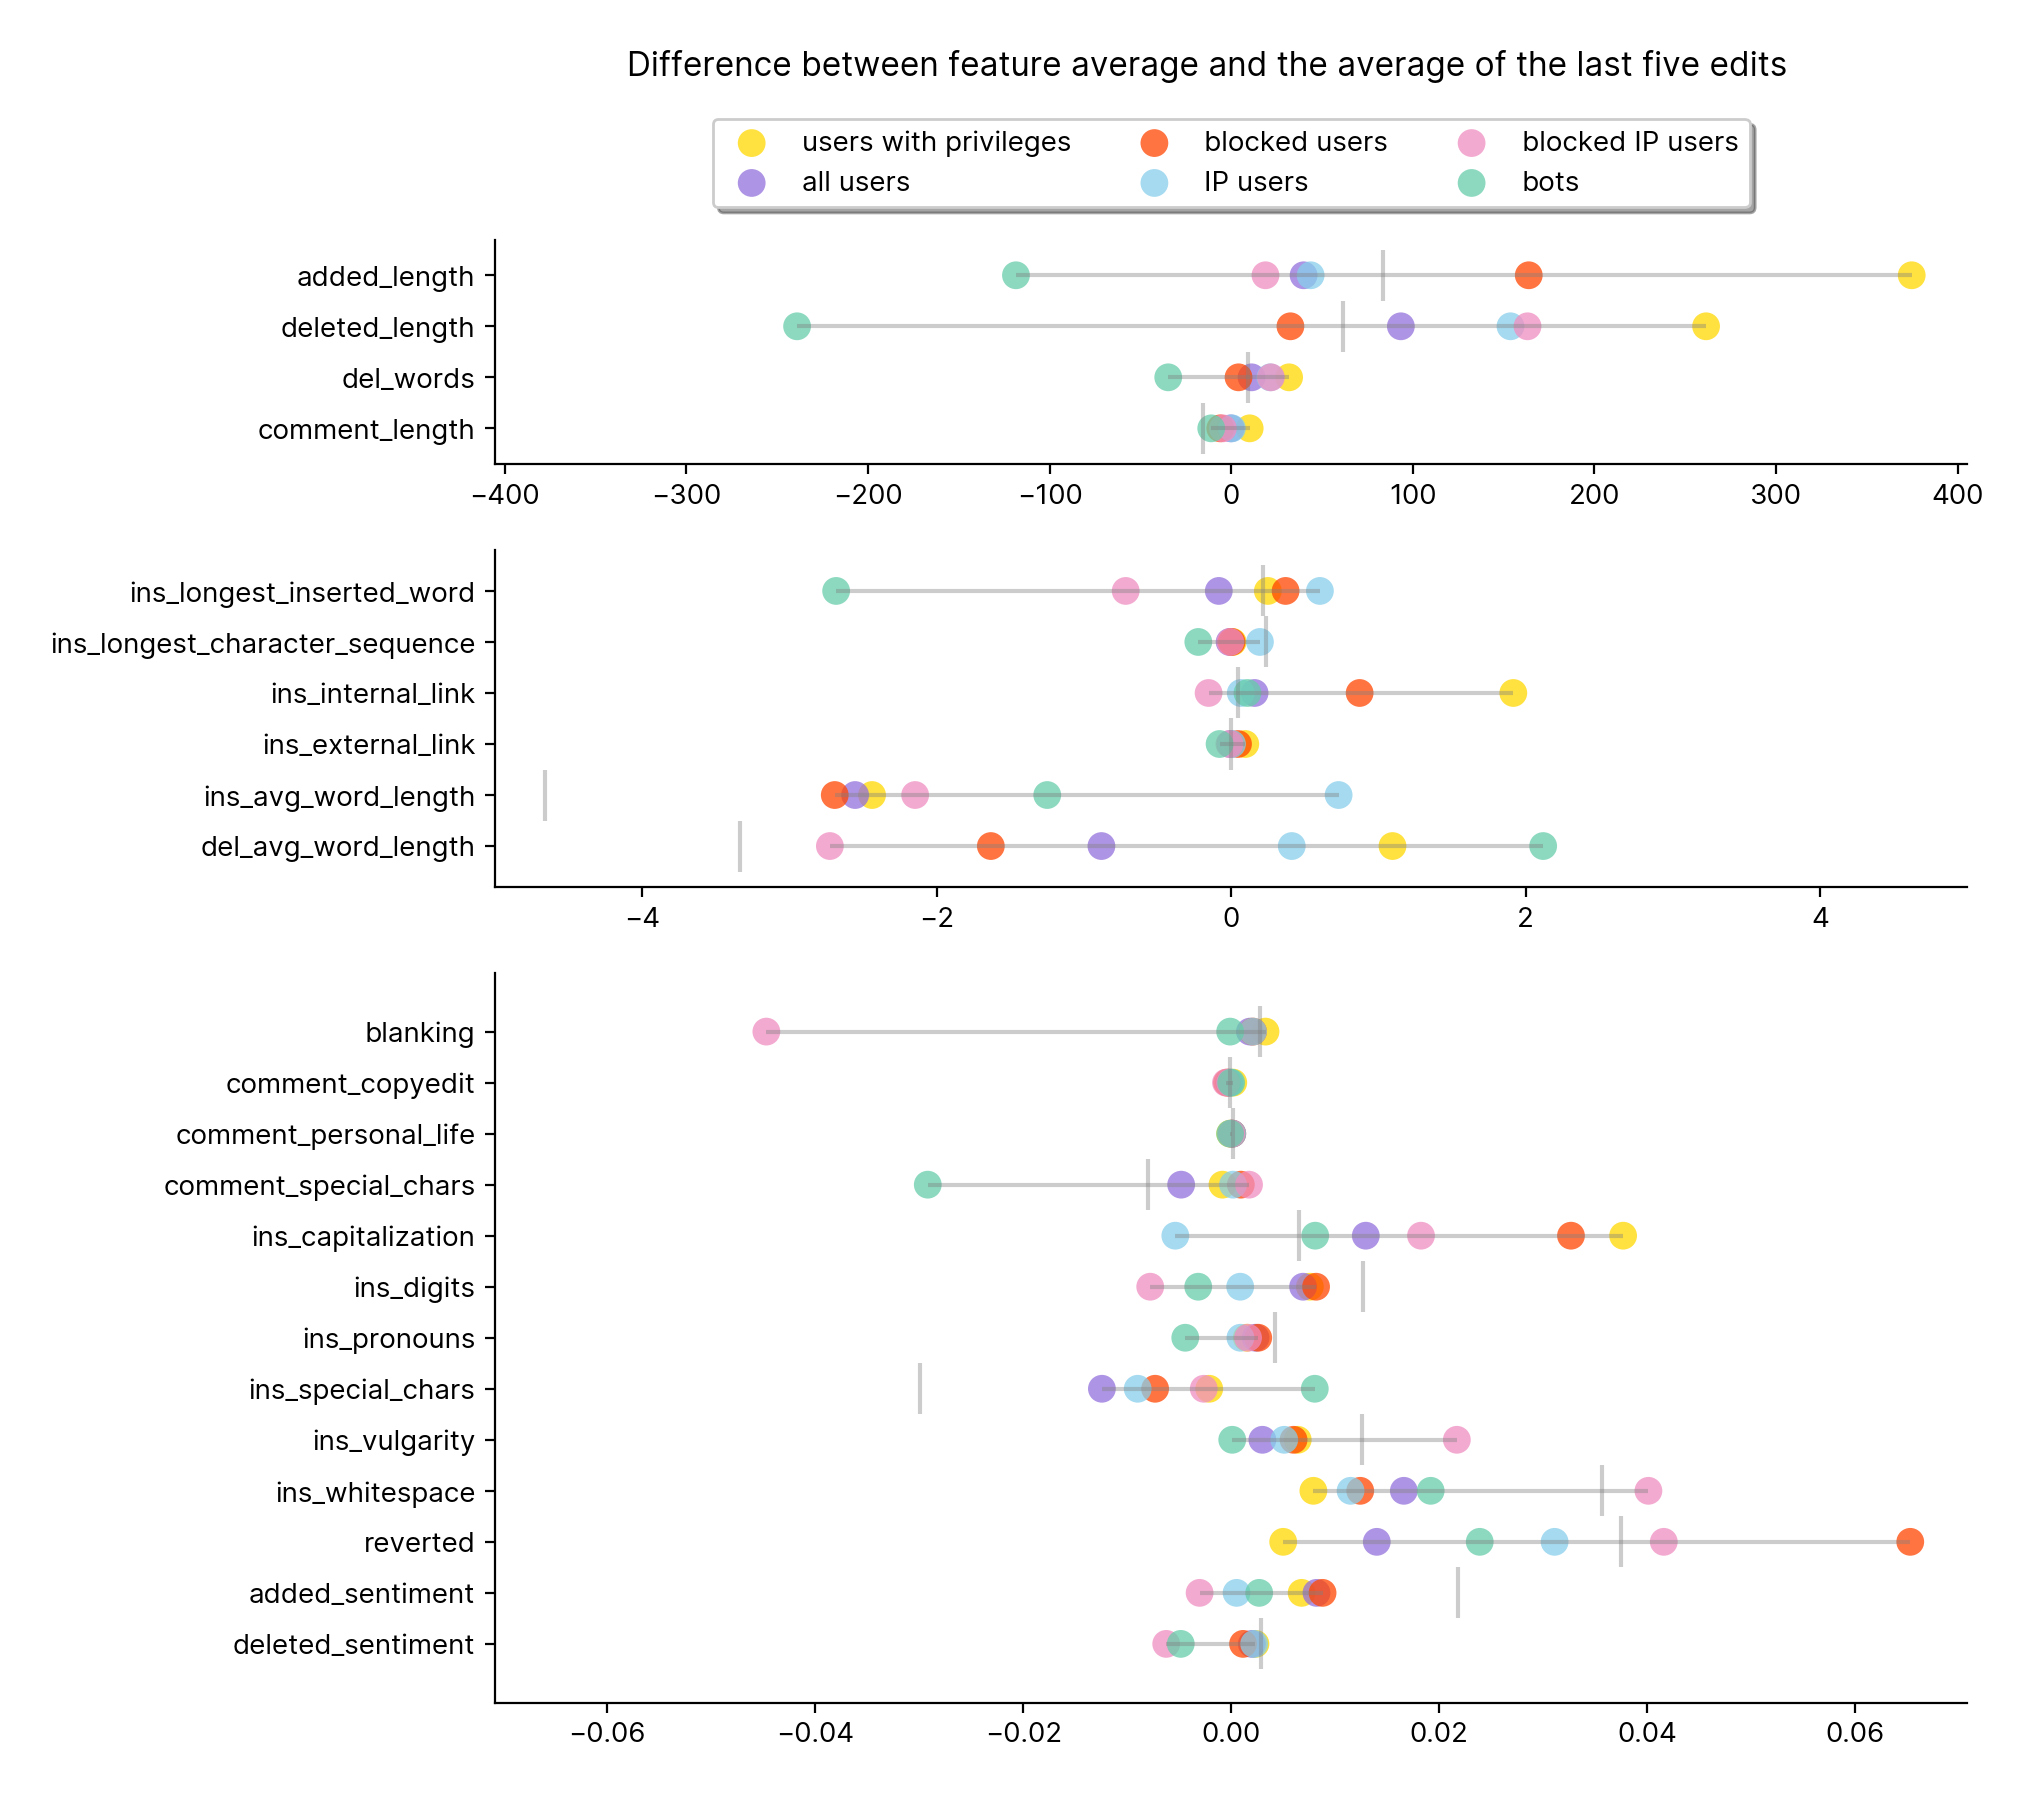
Figure 28
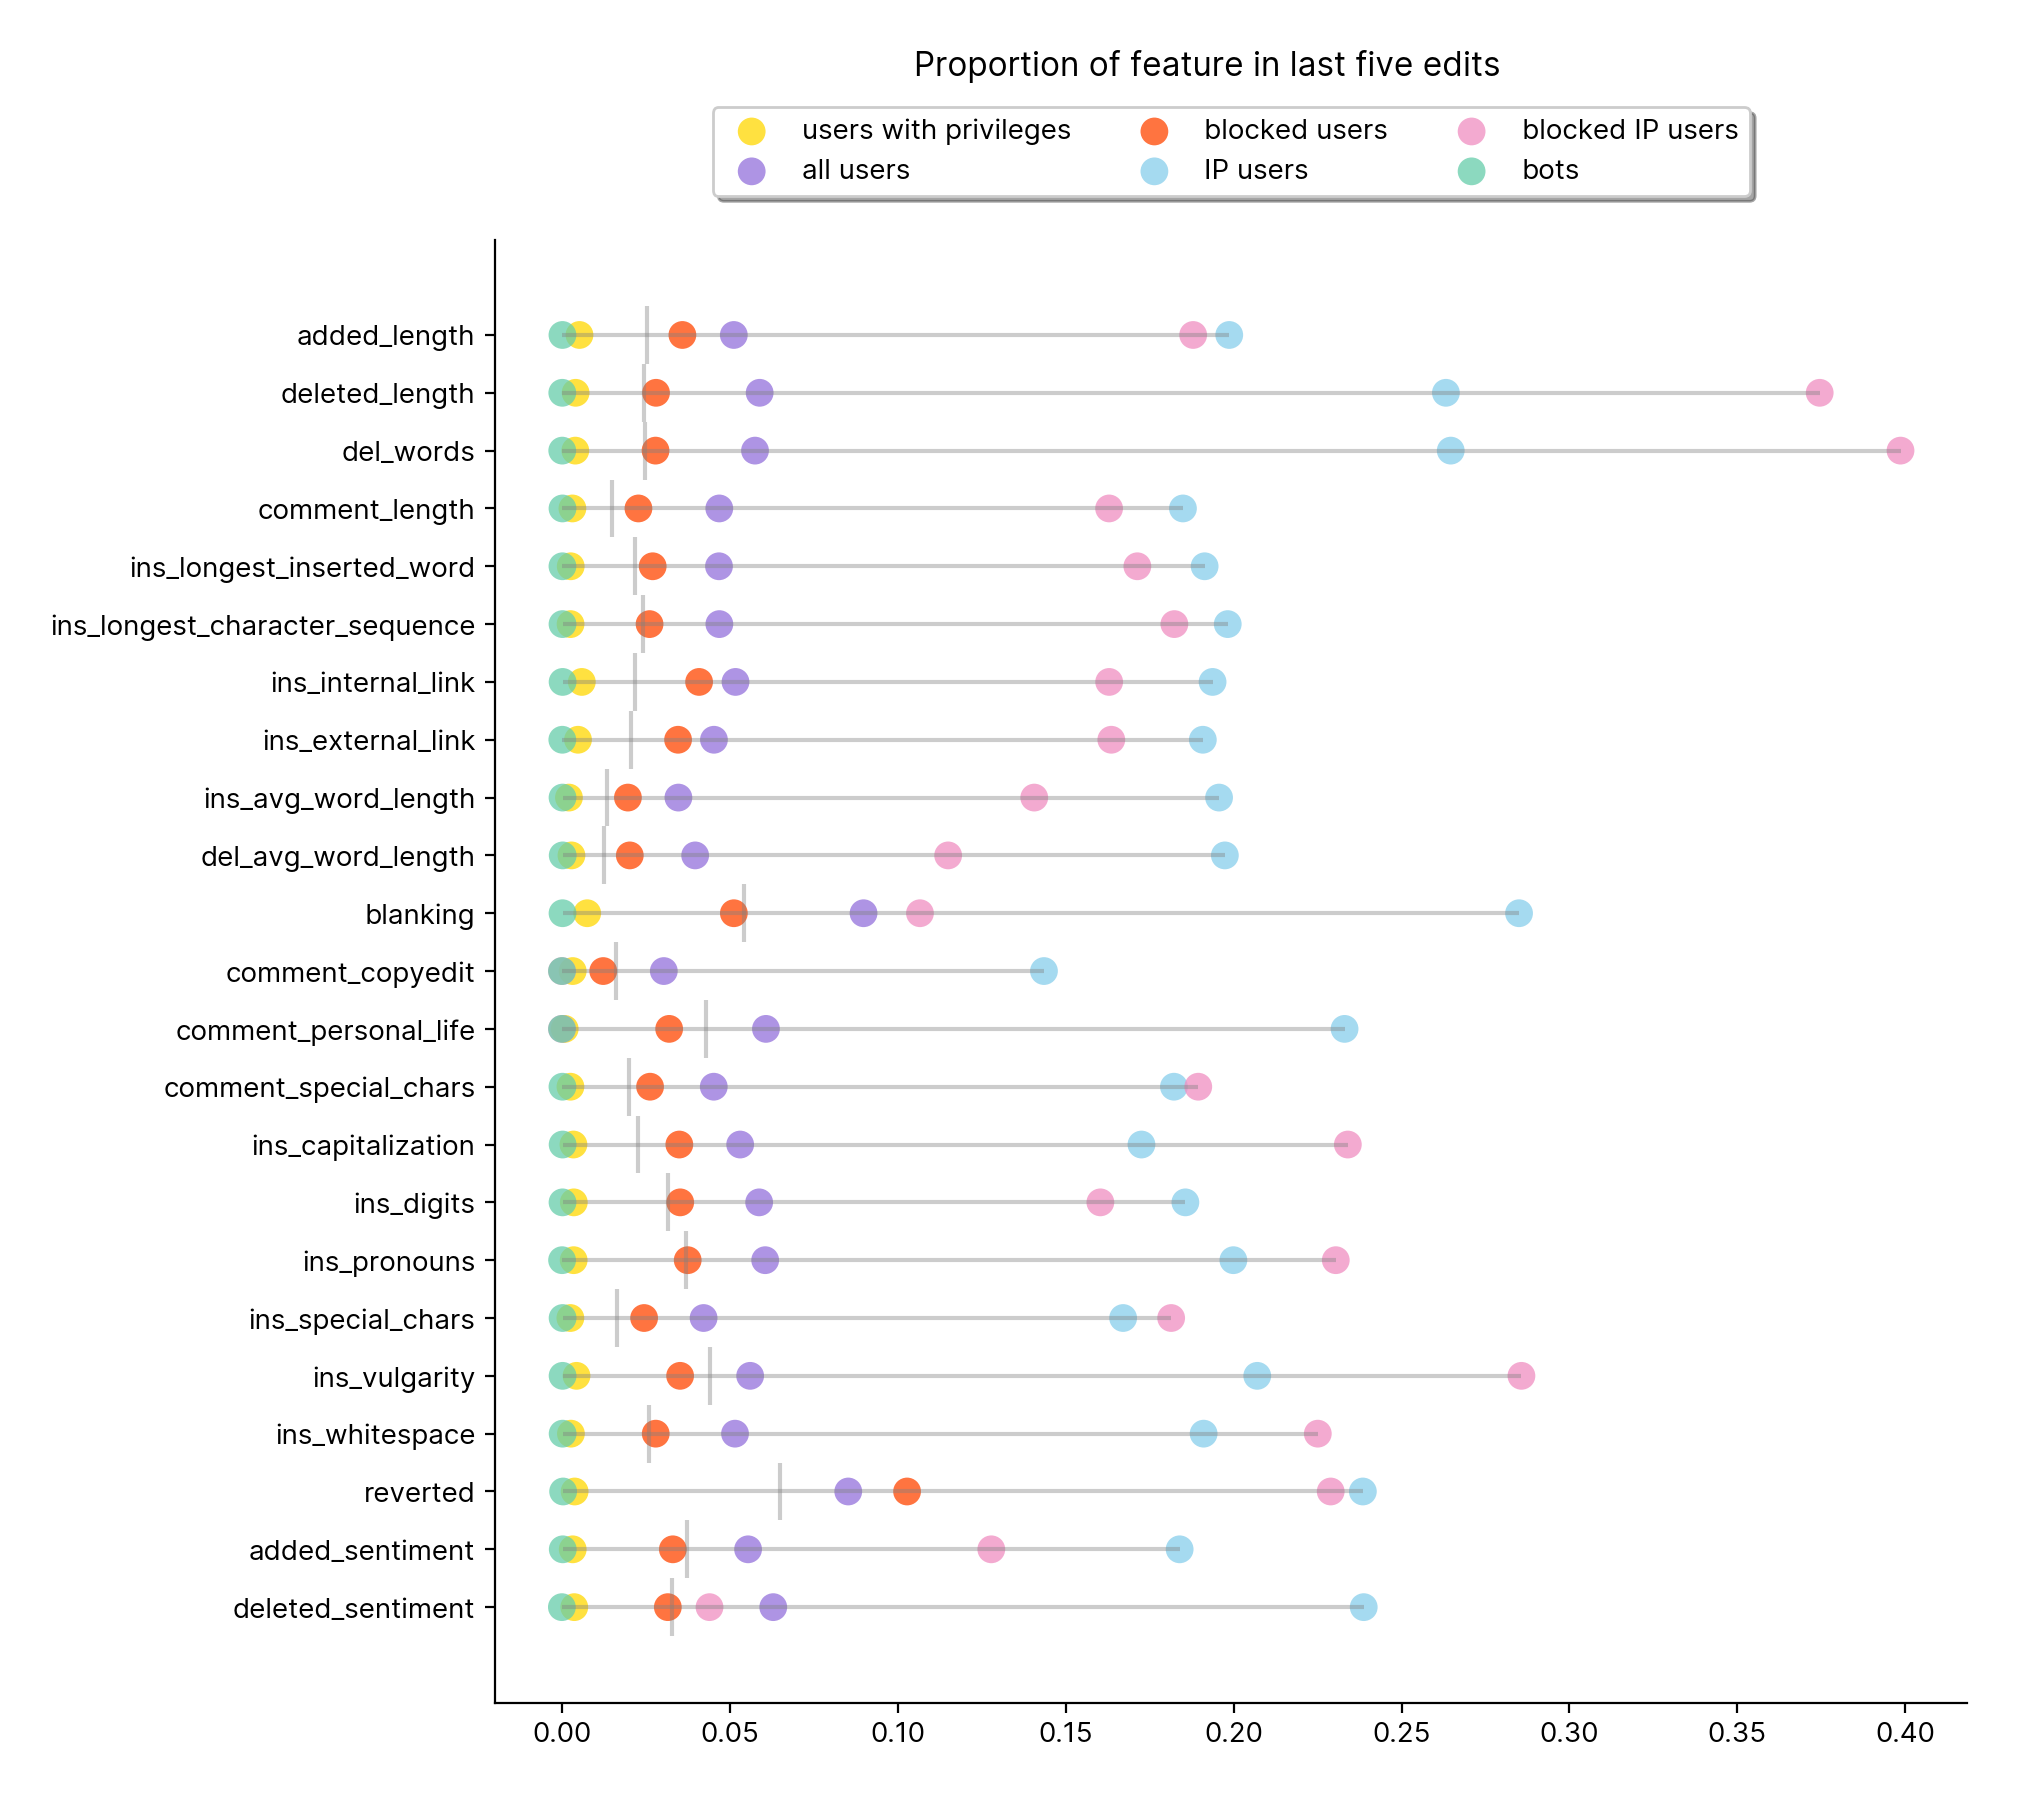
Figure 33
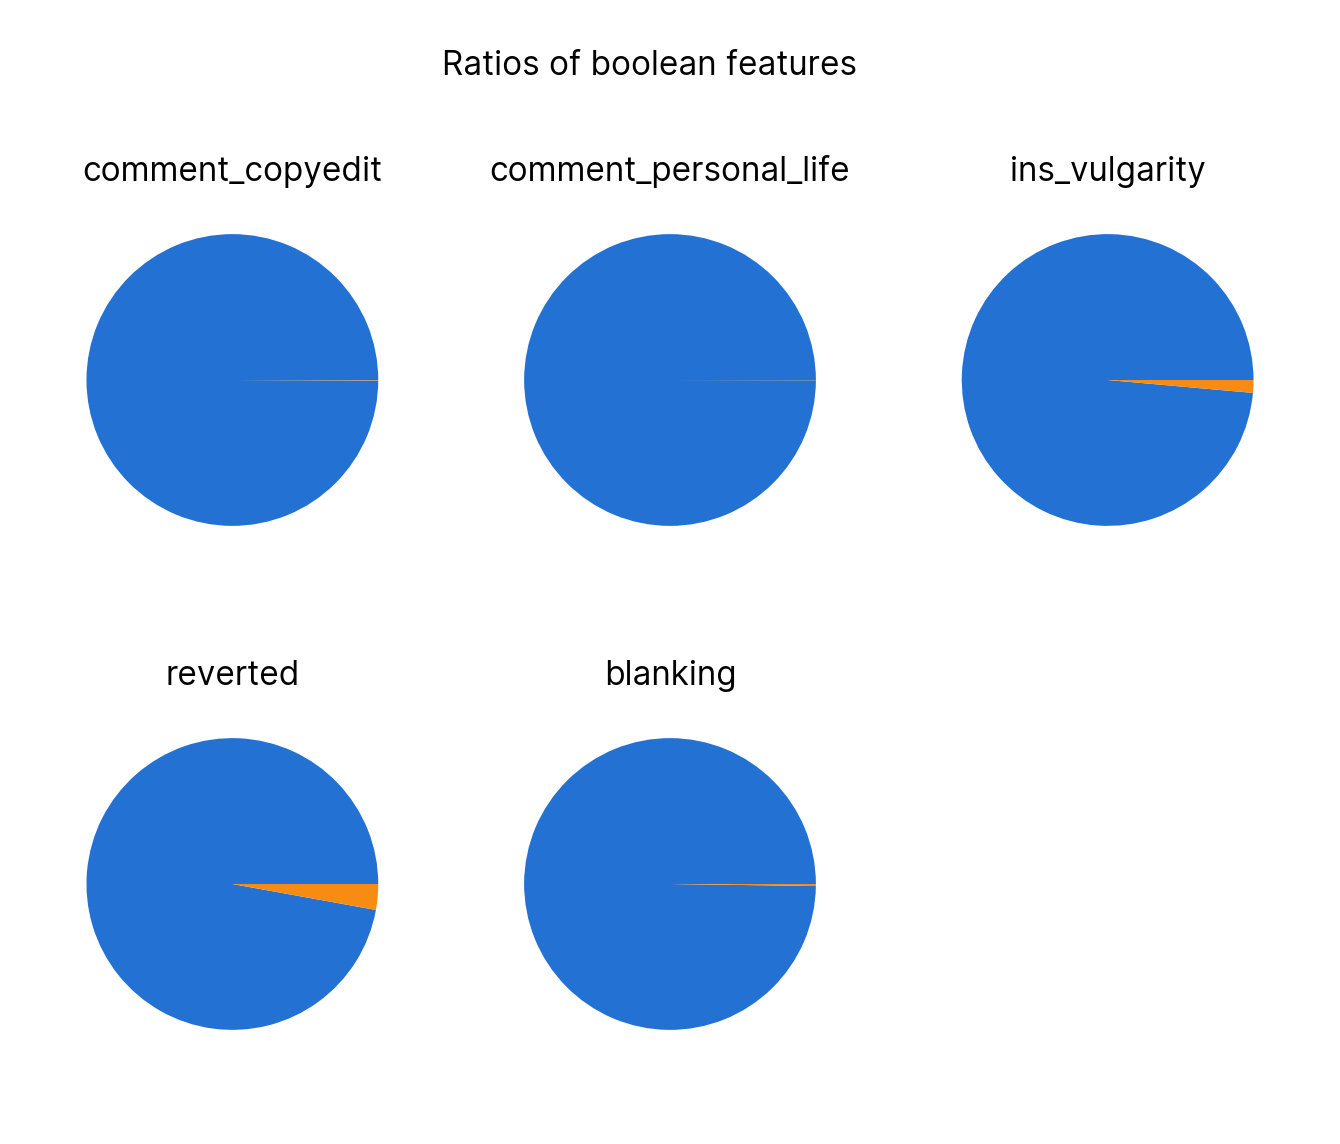
Figure 23
This shows the proportion of edits which have a specific boolean feature.
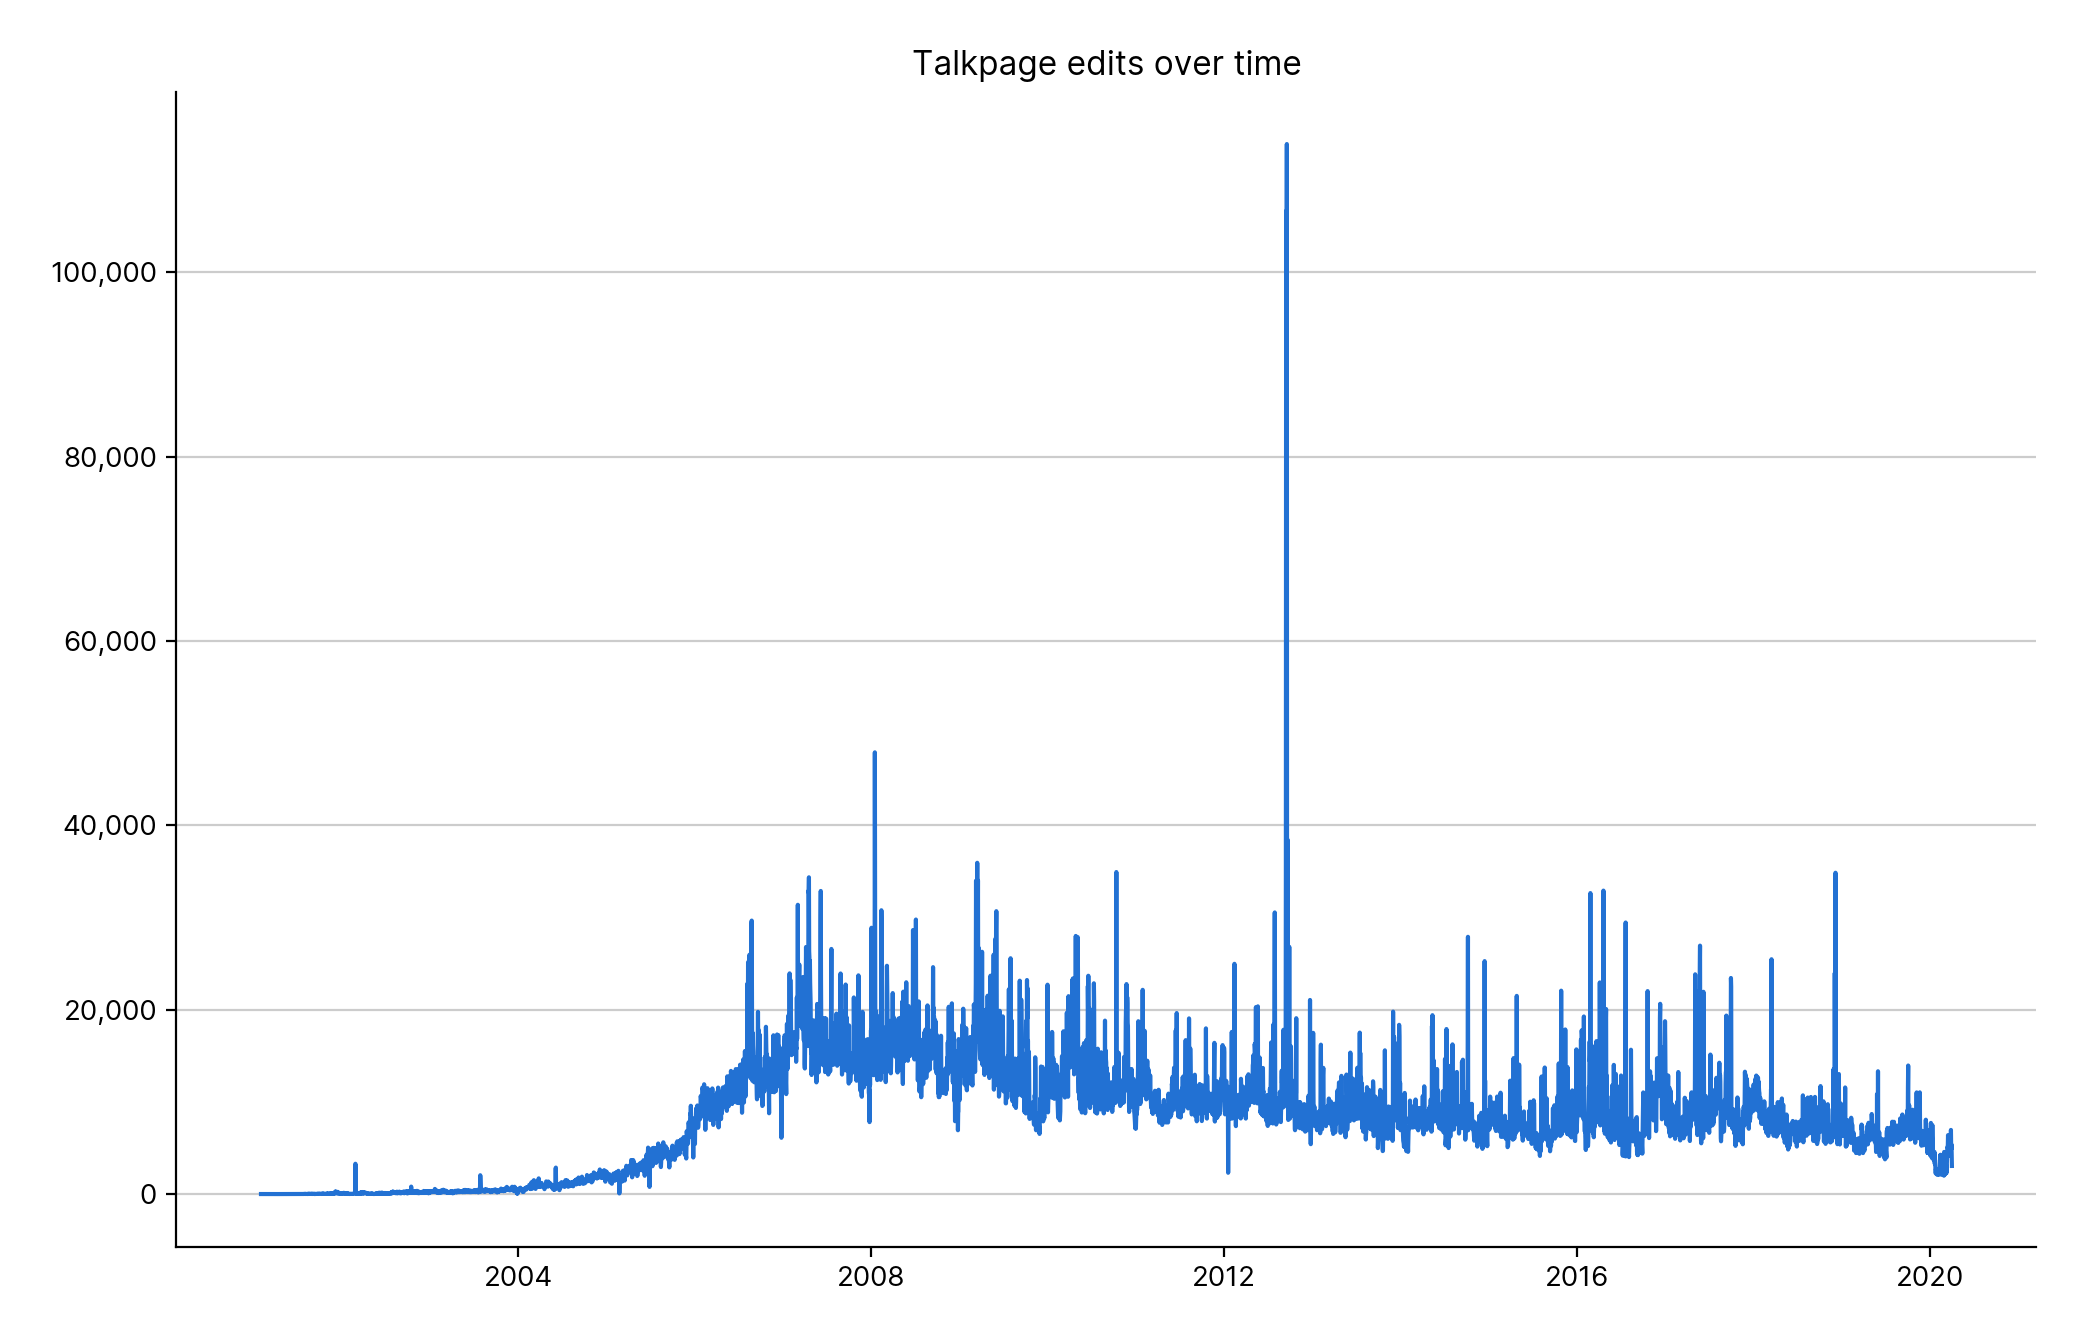
Figure 25
The large spike is from the 14th-17th of September 2012 and was the result of Yobot making 329,486 edits in 4 days, phew!
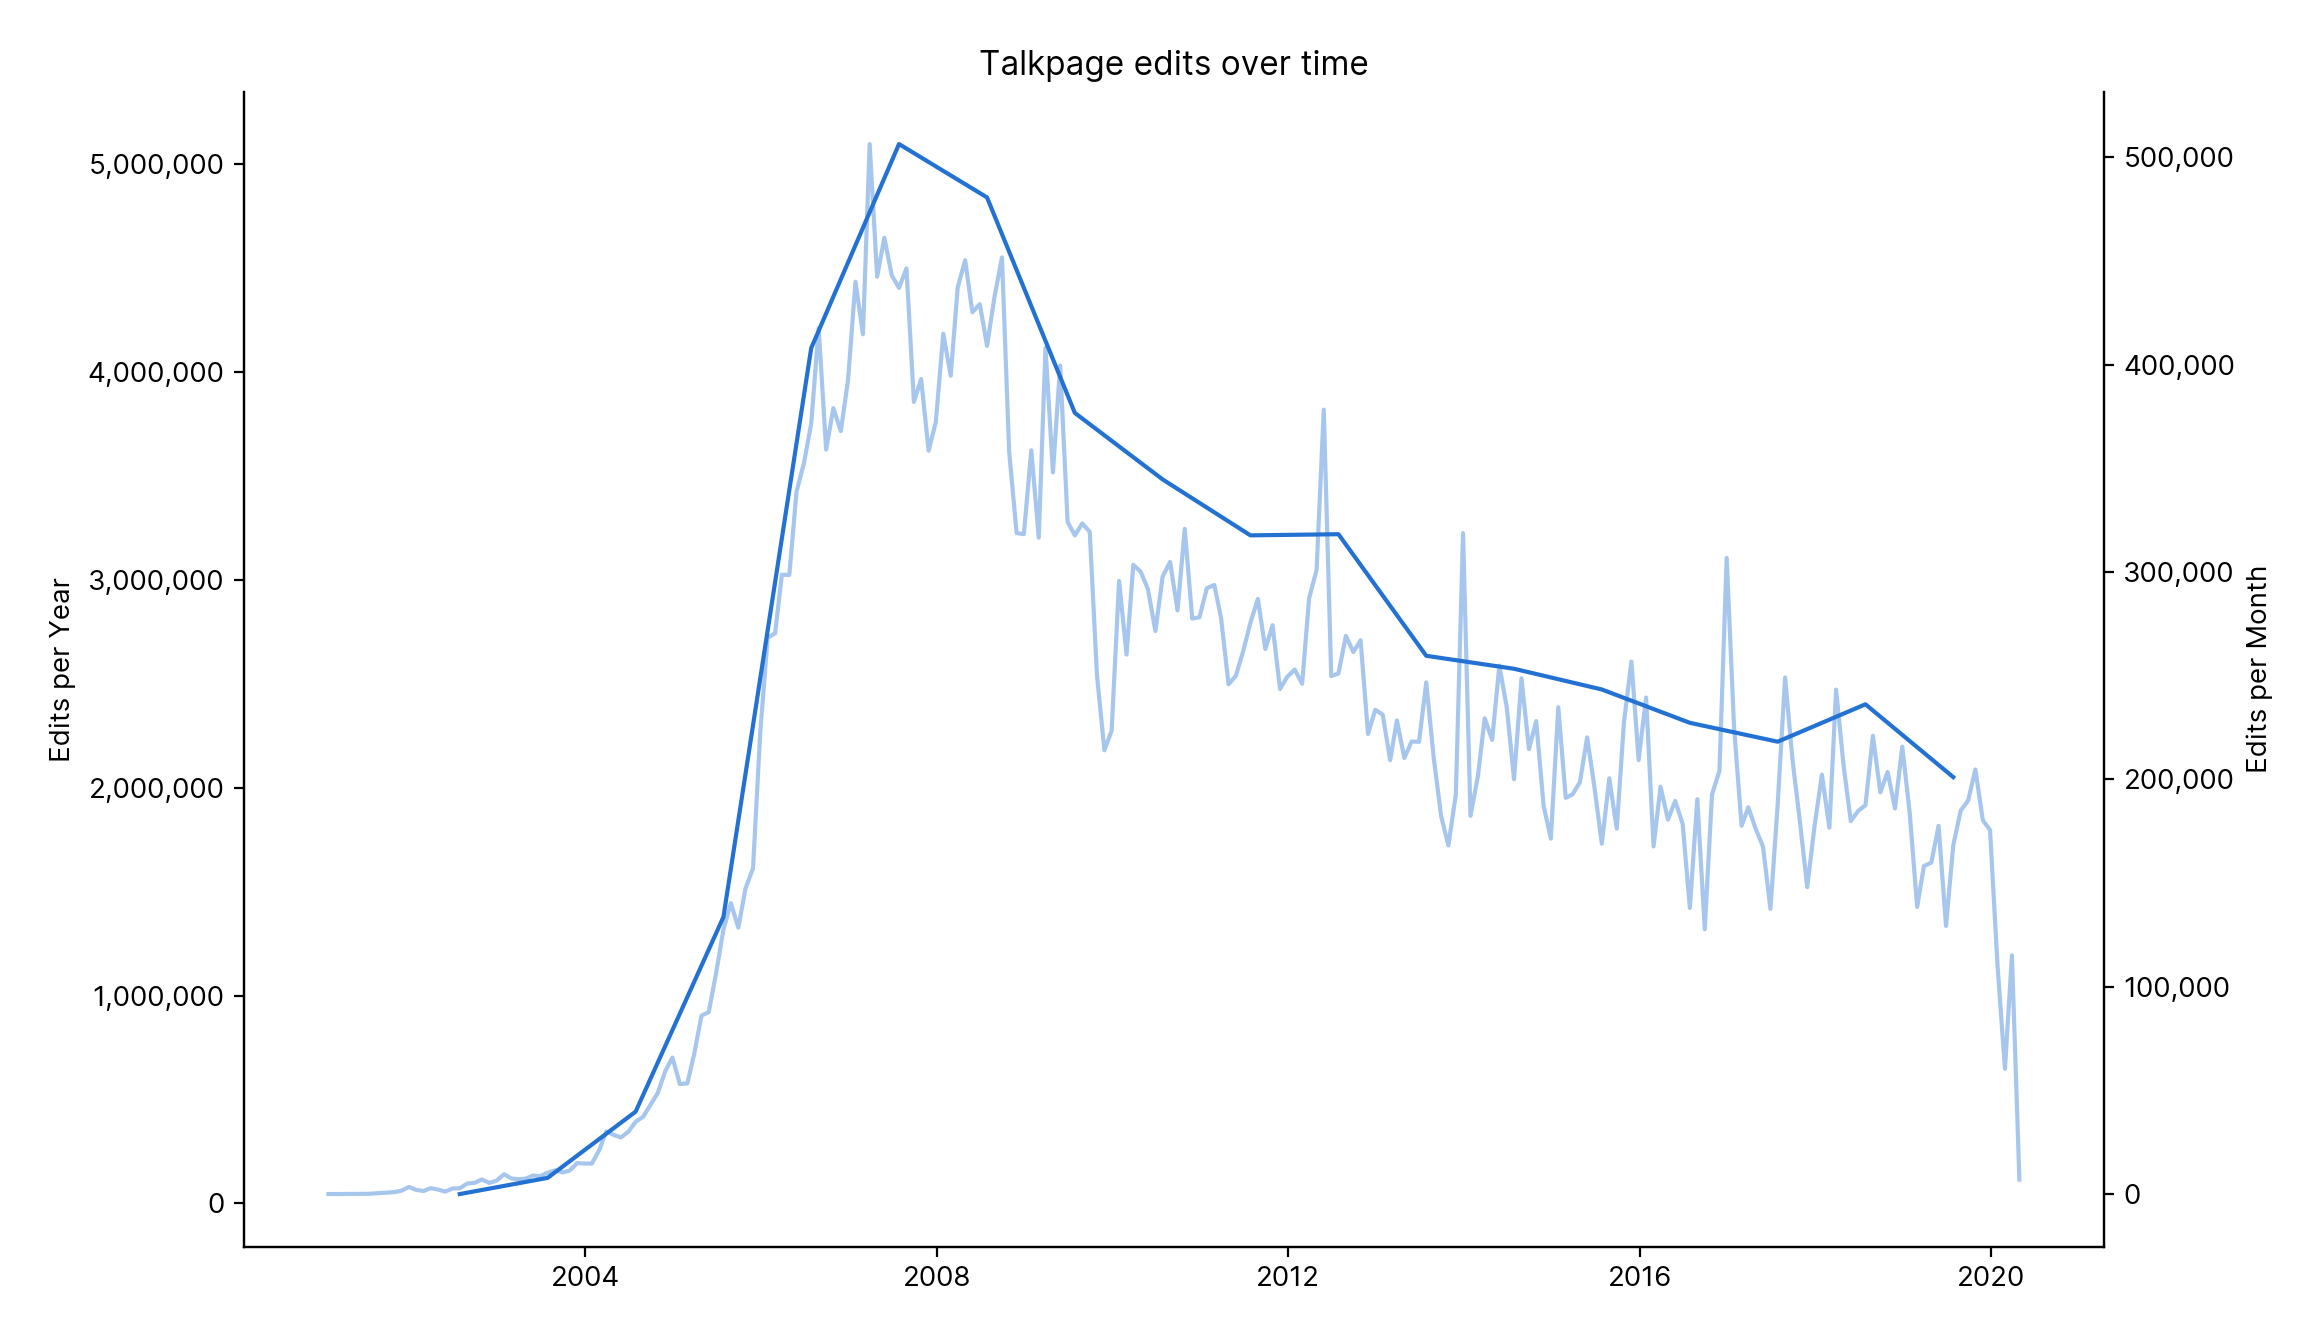
Figure 30.1
Figure 25 but per year and per month, the large spike in 2012 even seems to appear in the yearly plot. It does seem that talkpage engagement has fallen since 2007 at 6,072,548 edits.
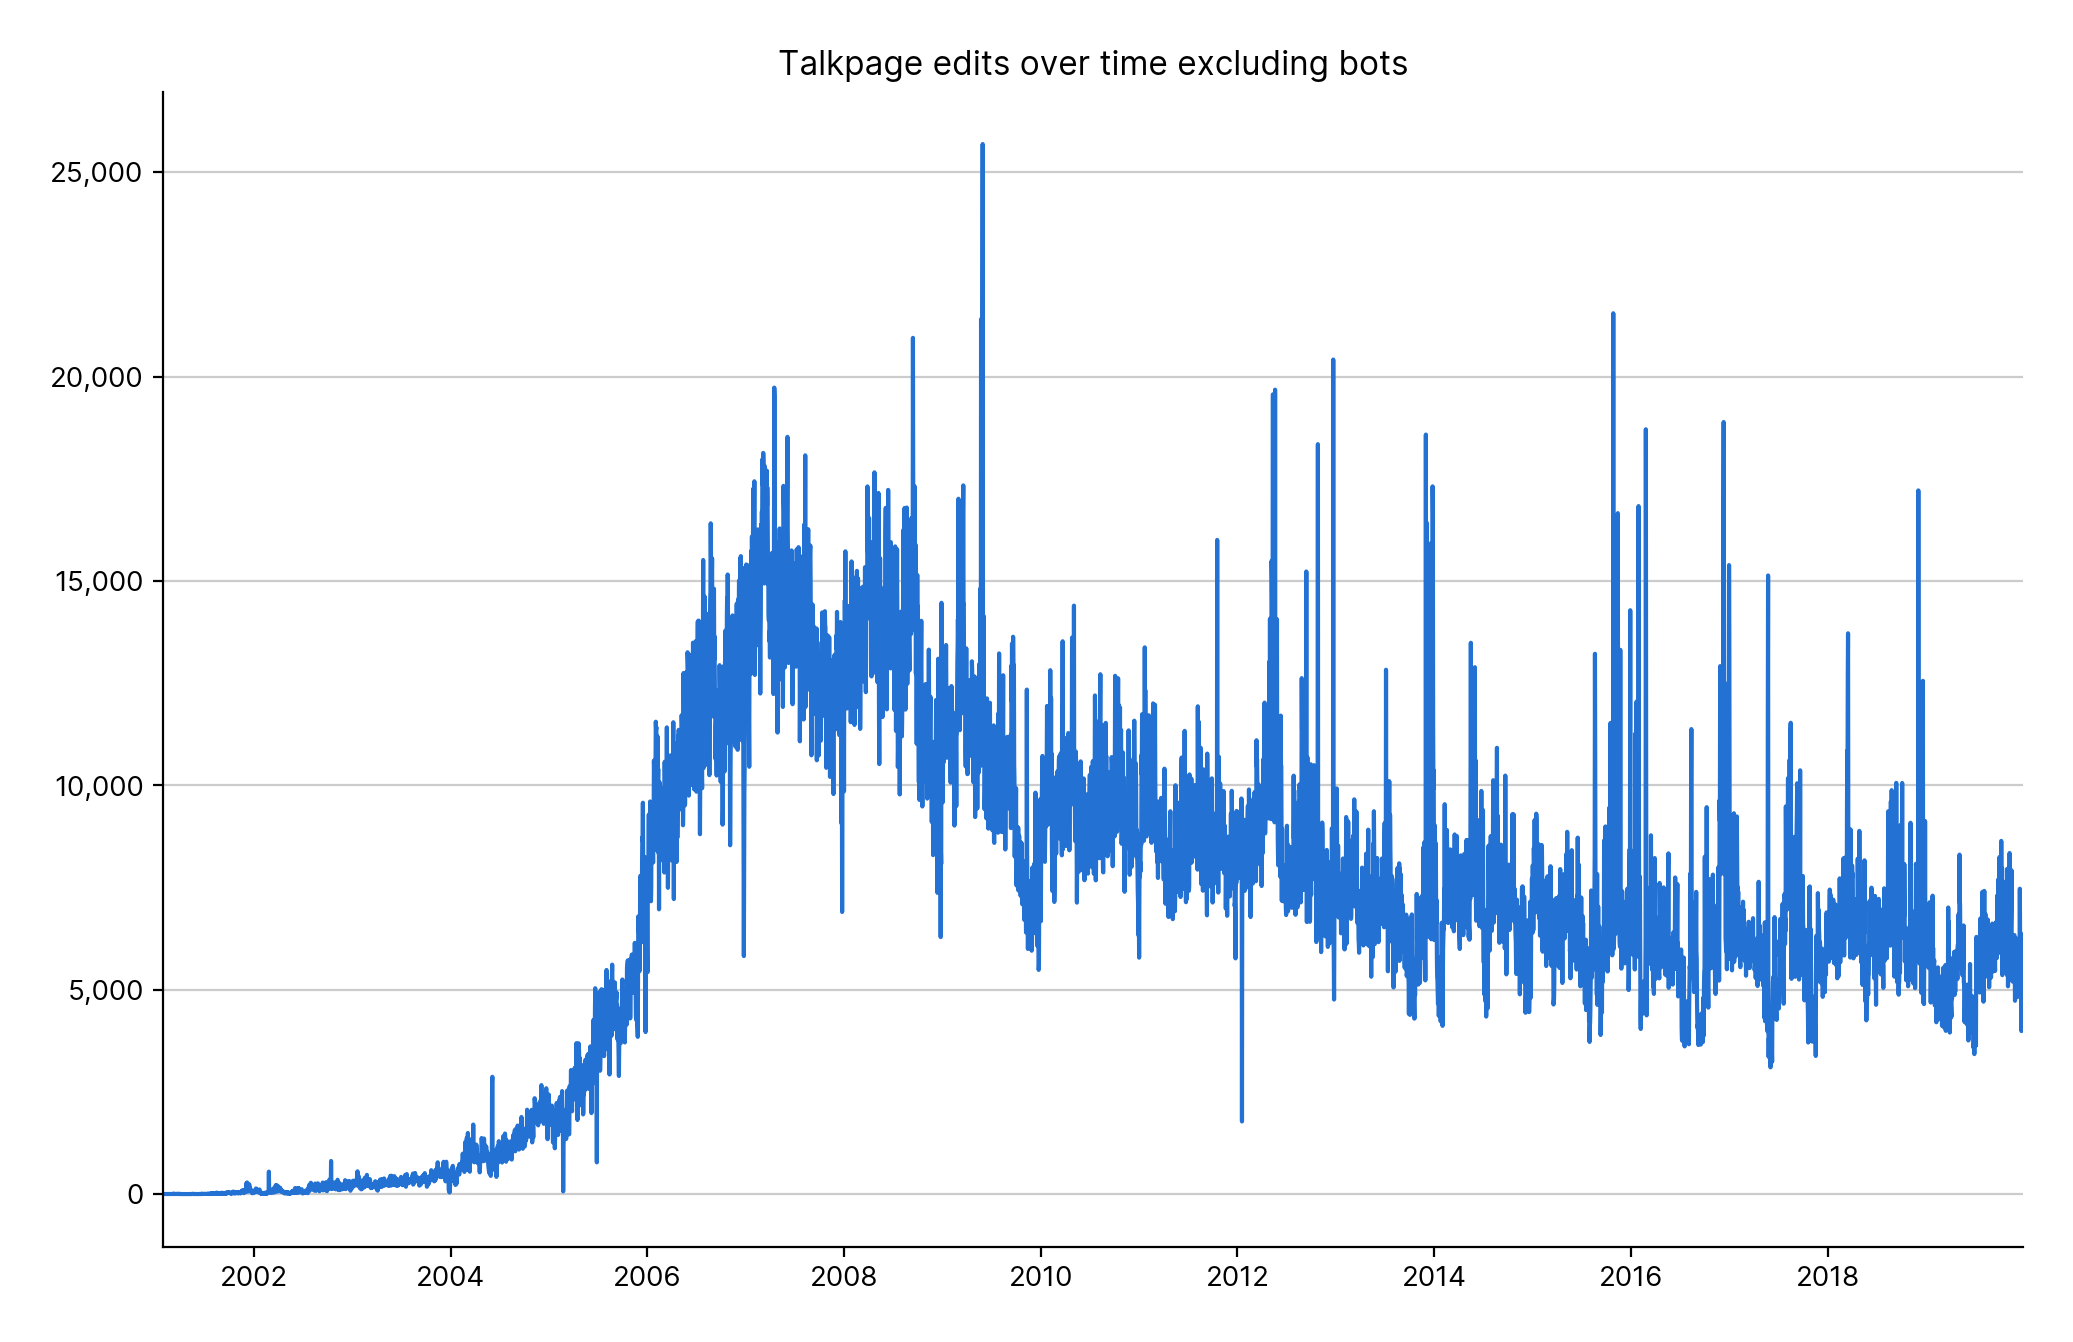
Figure 31
Much less noisy when bots are excluded.
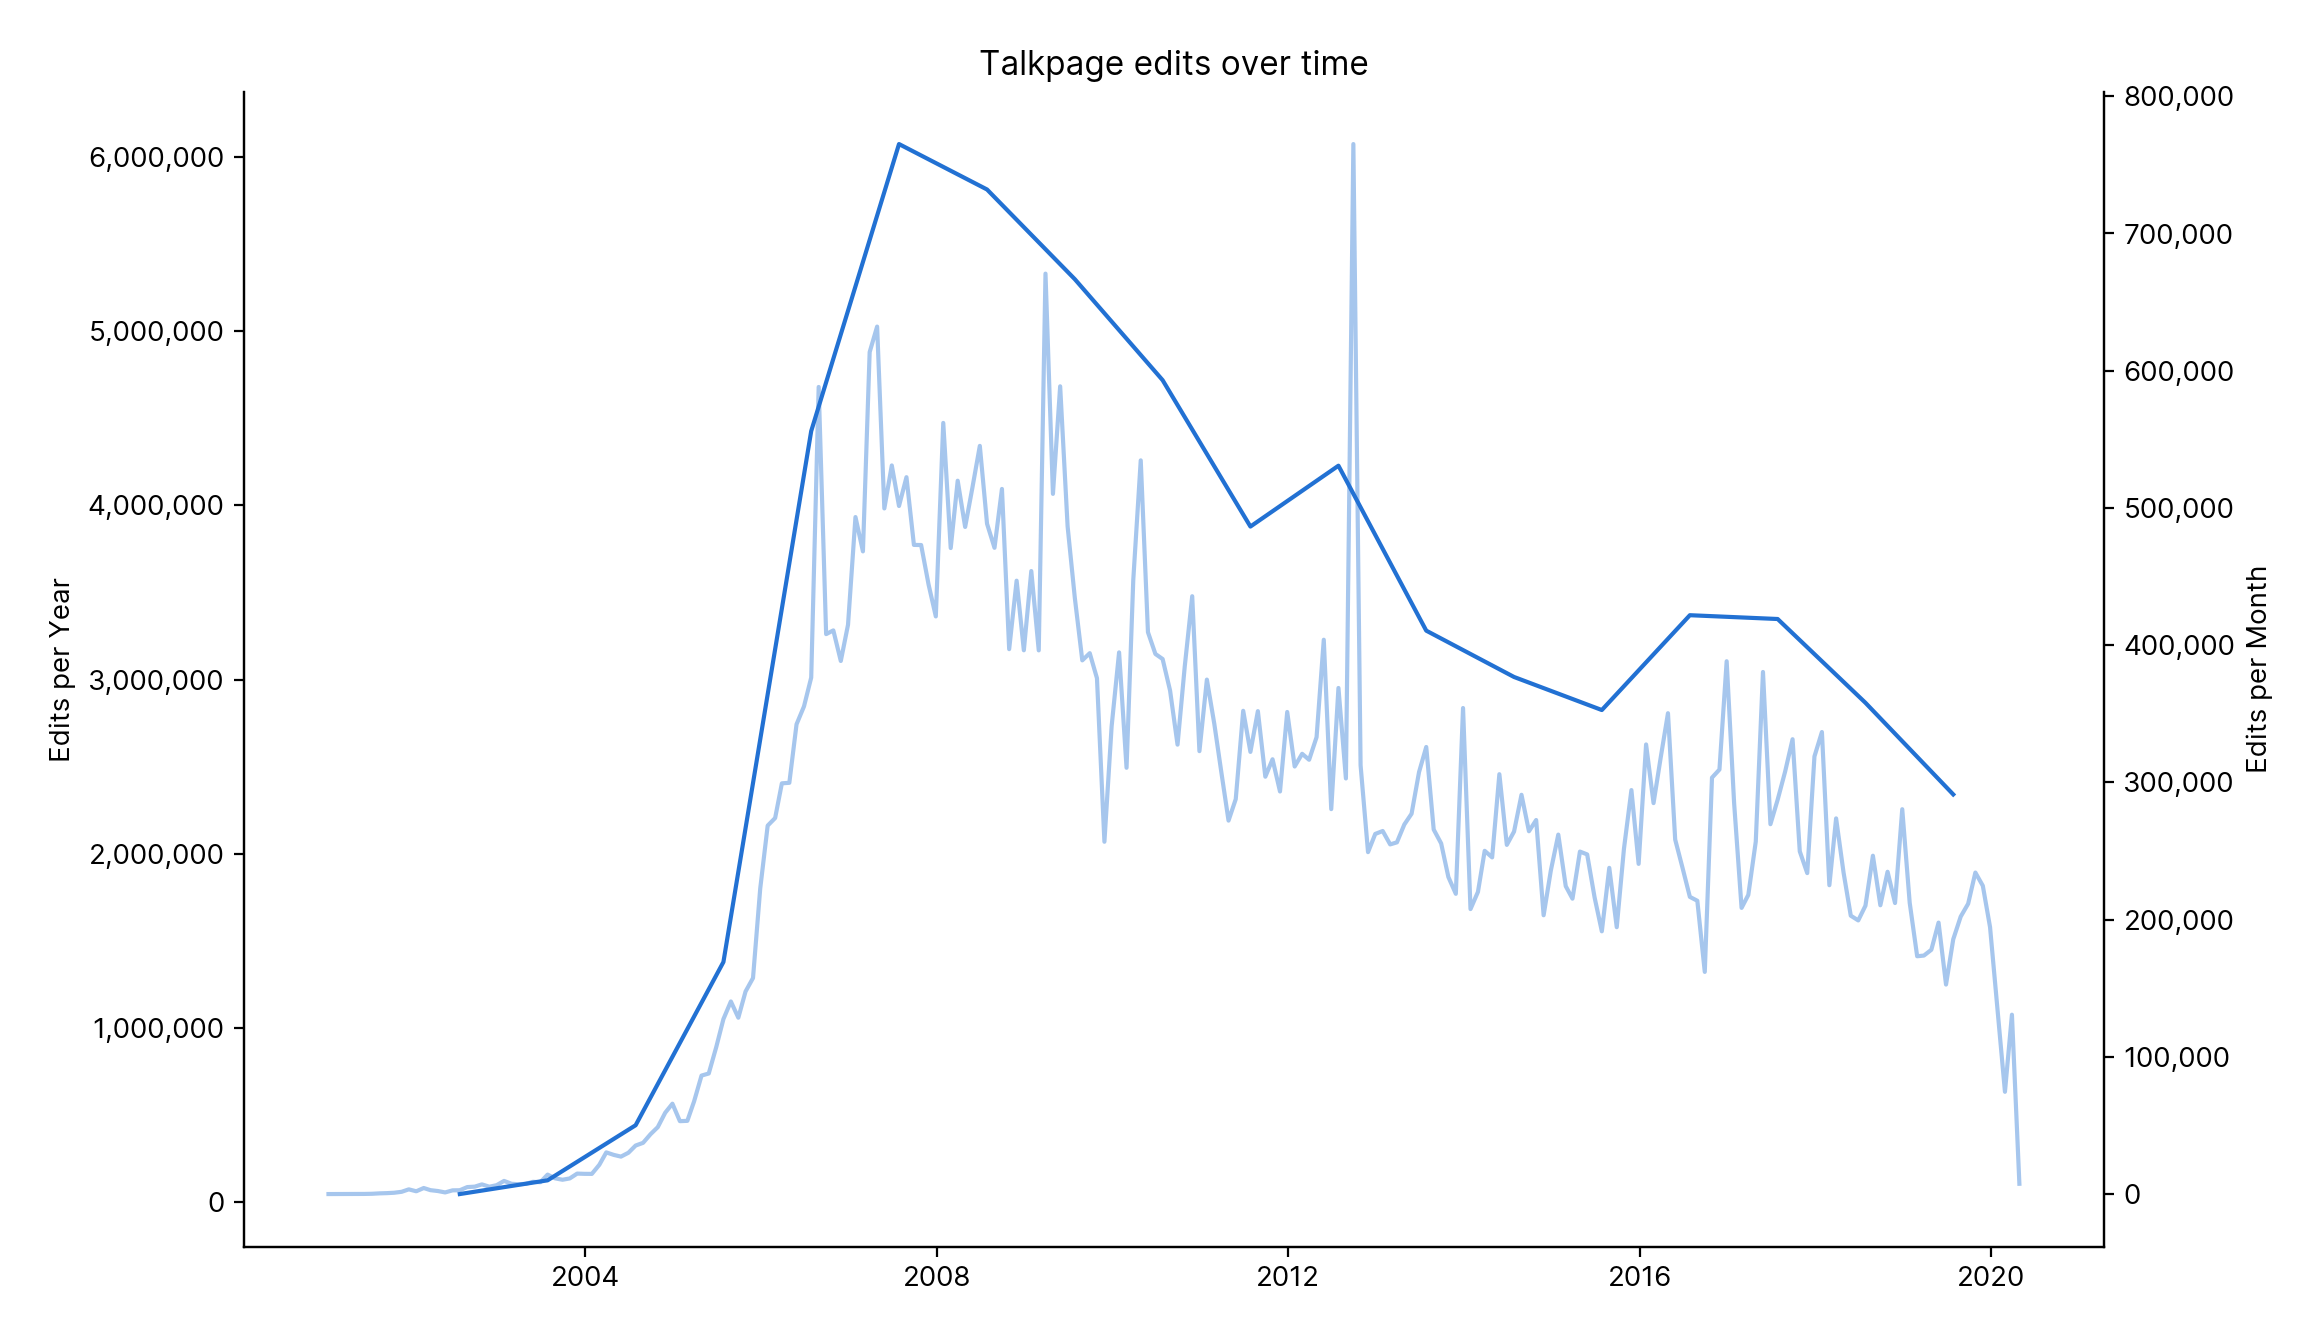
Figure 30.2
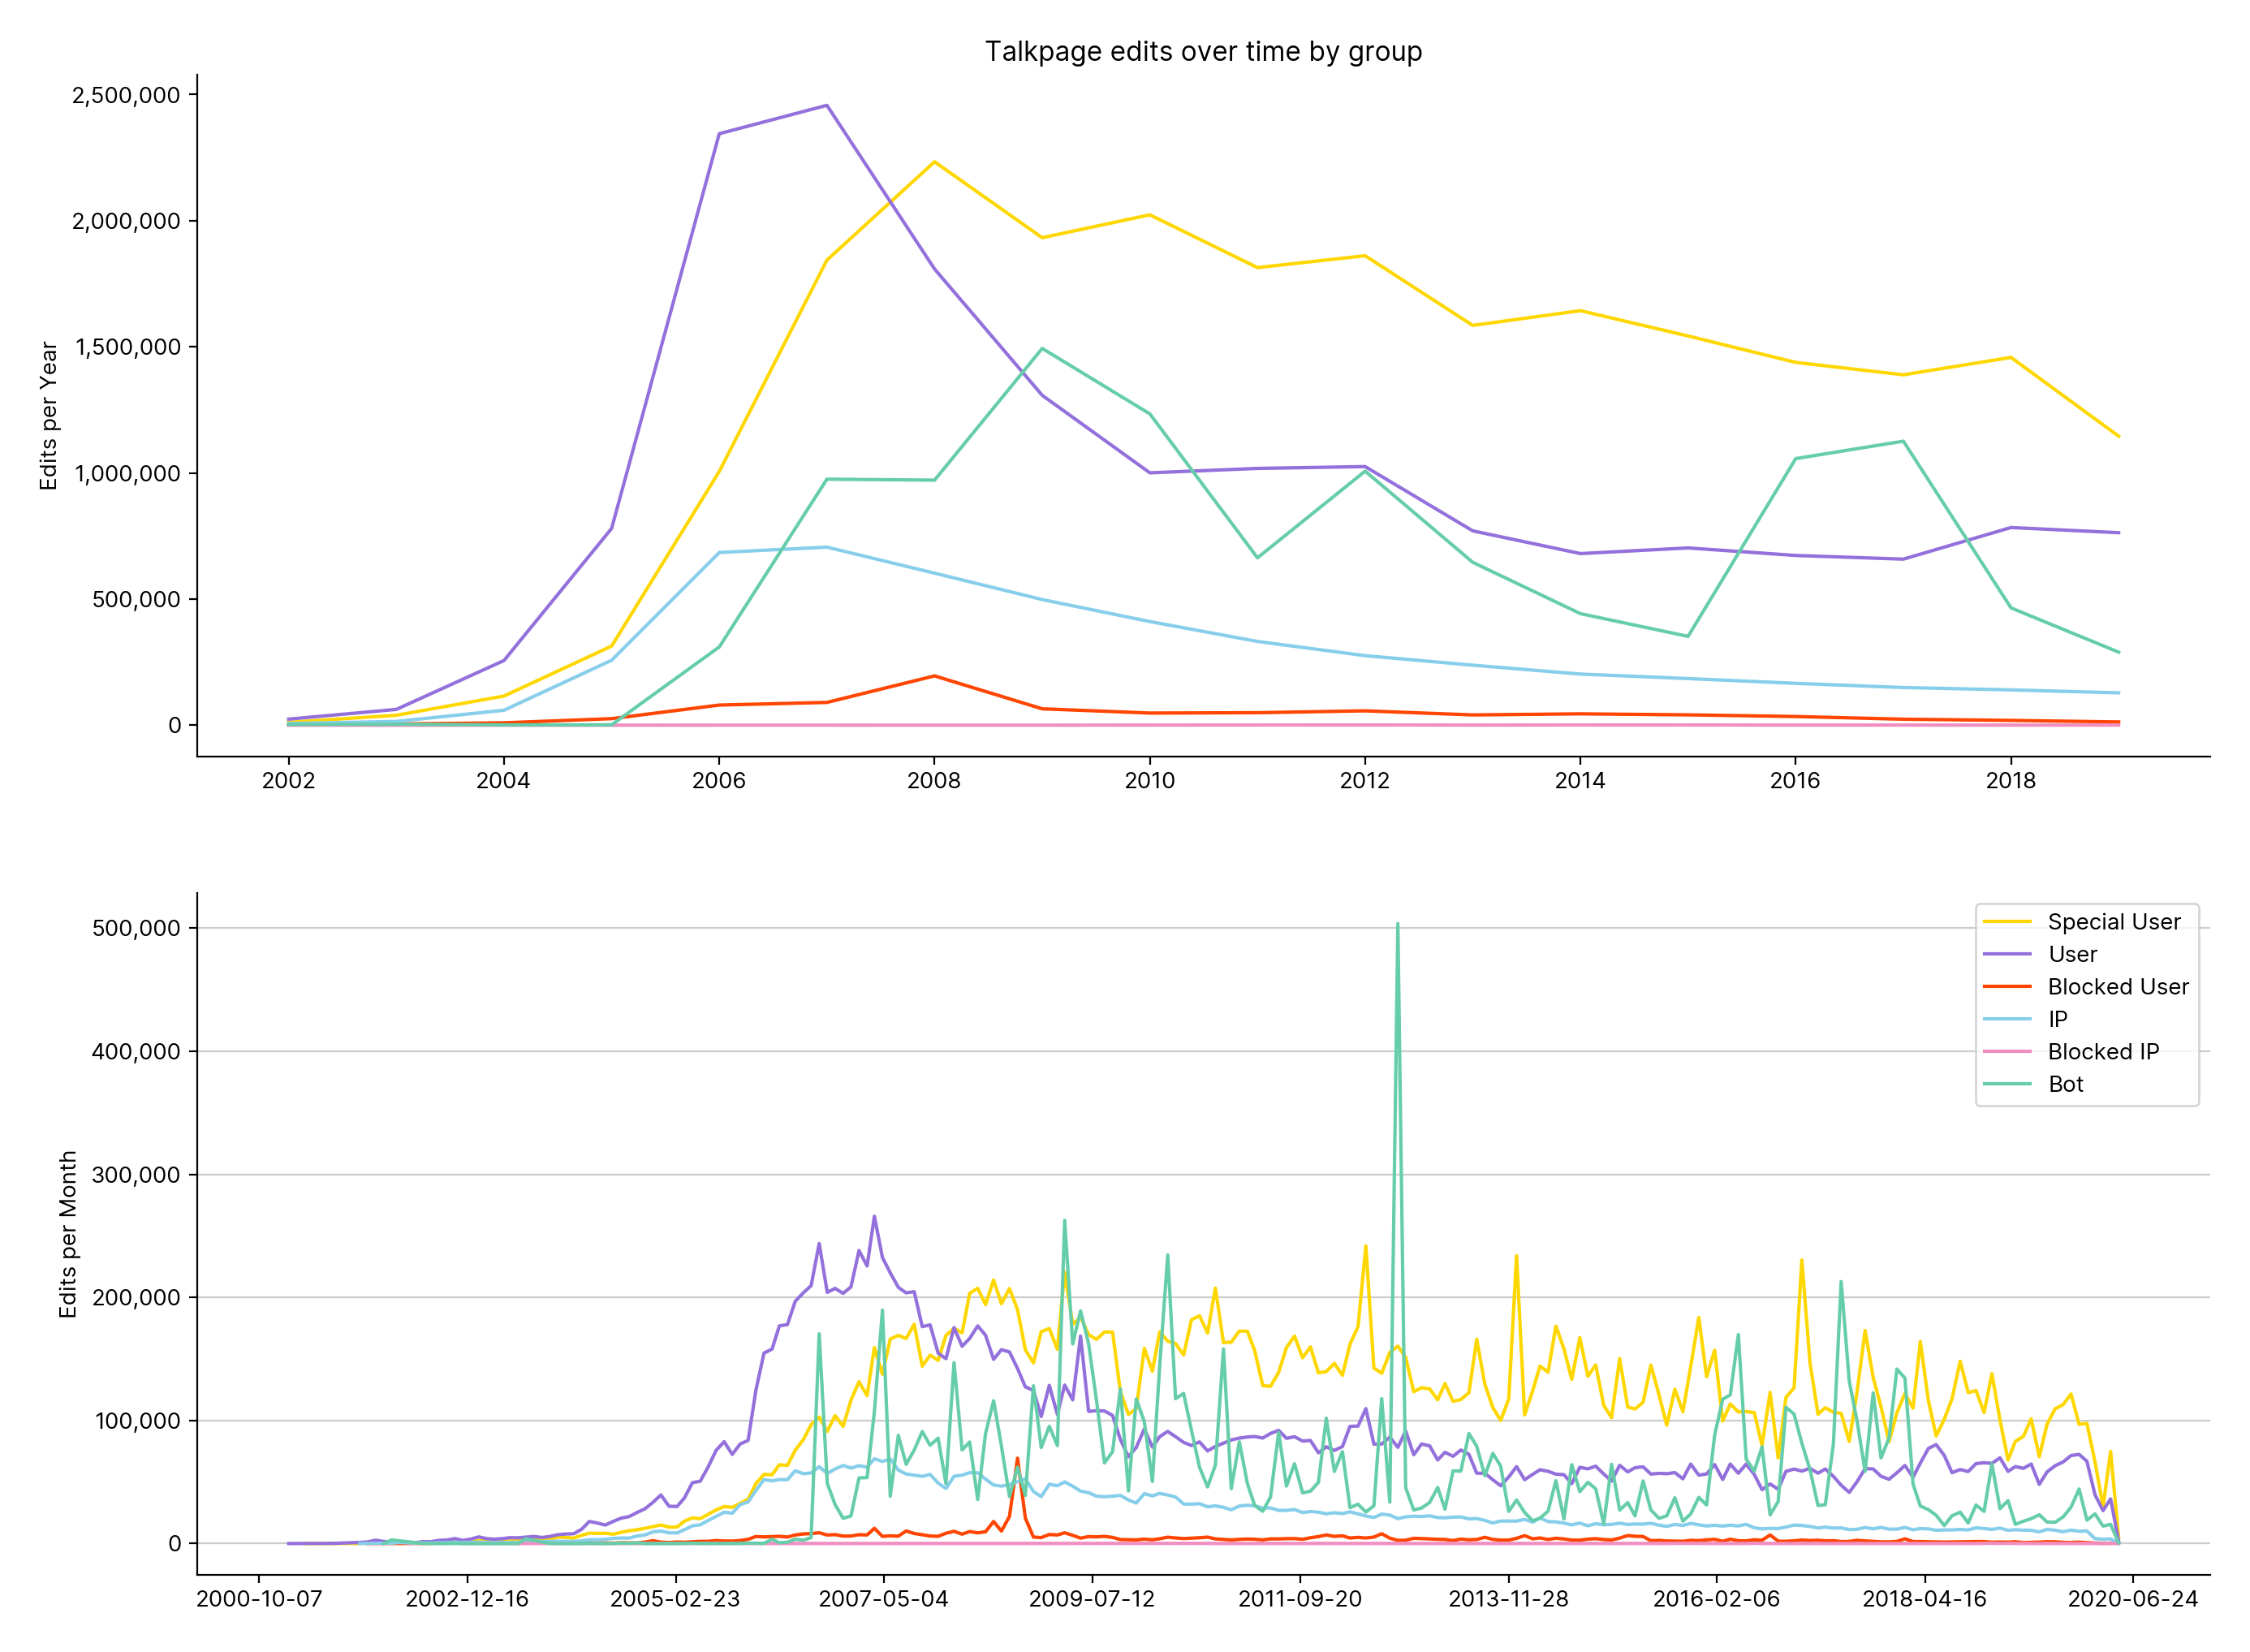
Figure 34
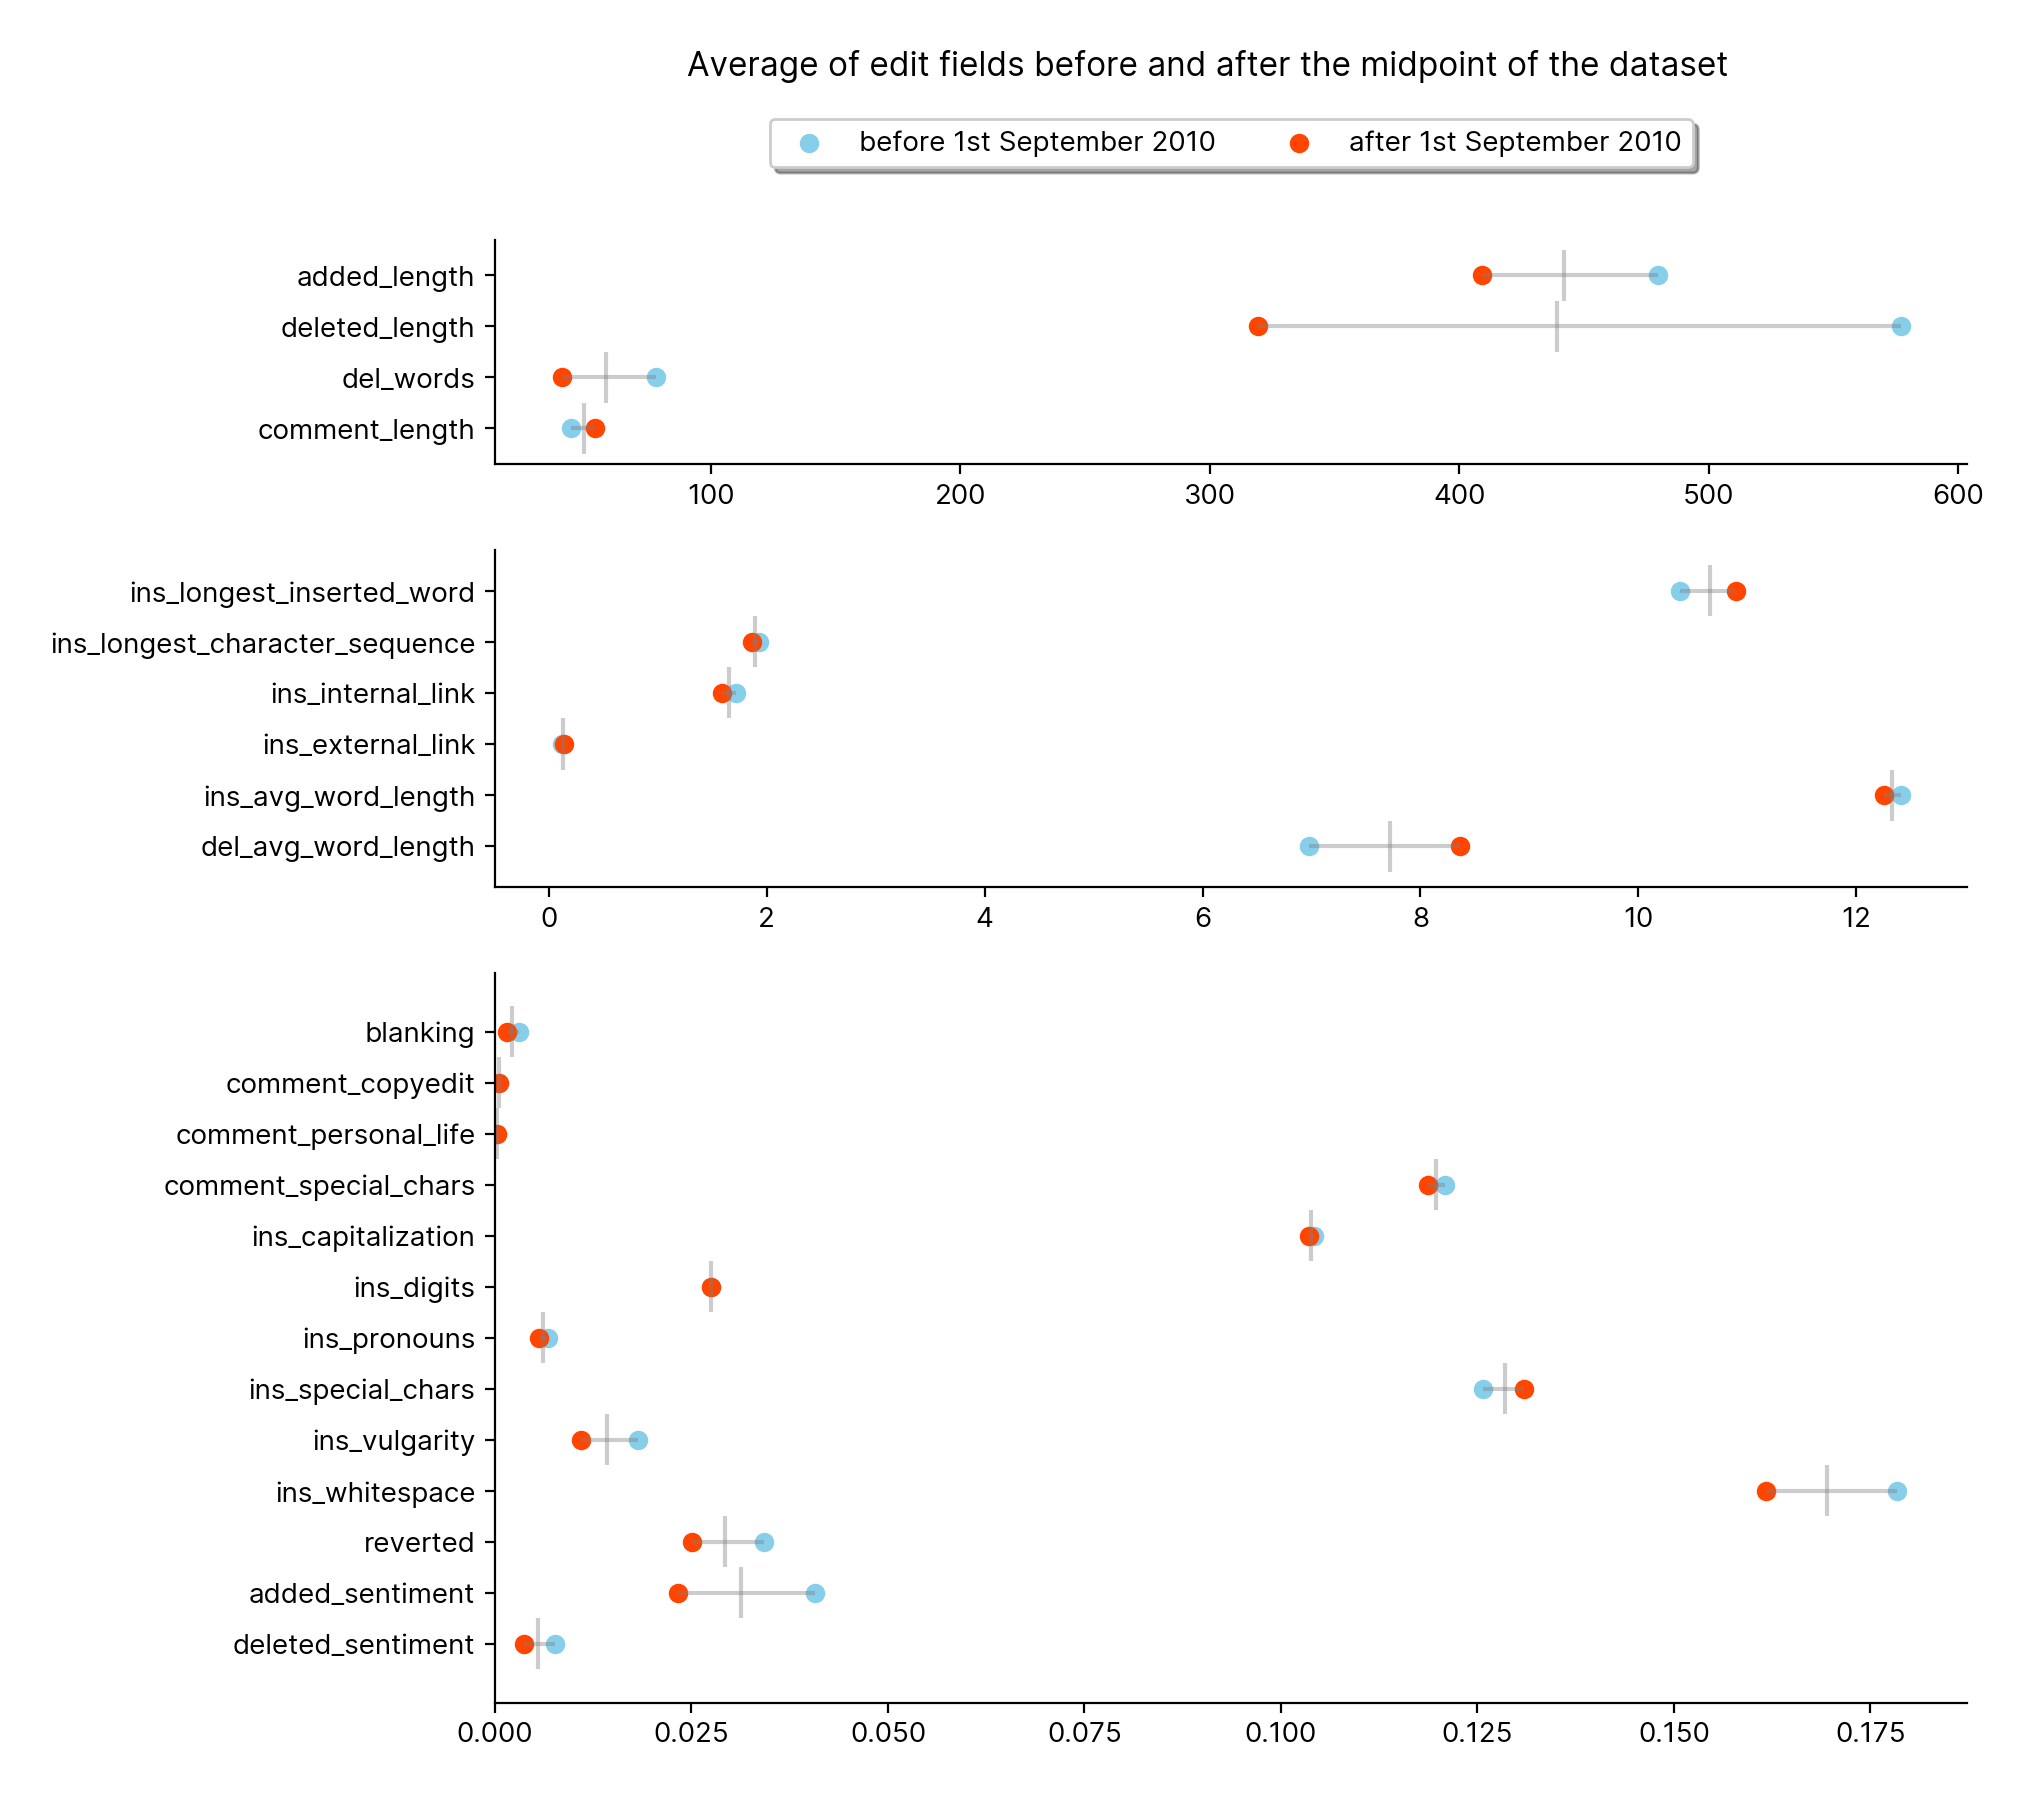
Figure 26
A plot similar, but showing how editing has changed in the first 9 years compared to the second 9 years of the dataset. There’s less vulgarity, less reversion, less blanking, longer comments so at this level Wikipedia talkpage edits seem healthier on average.
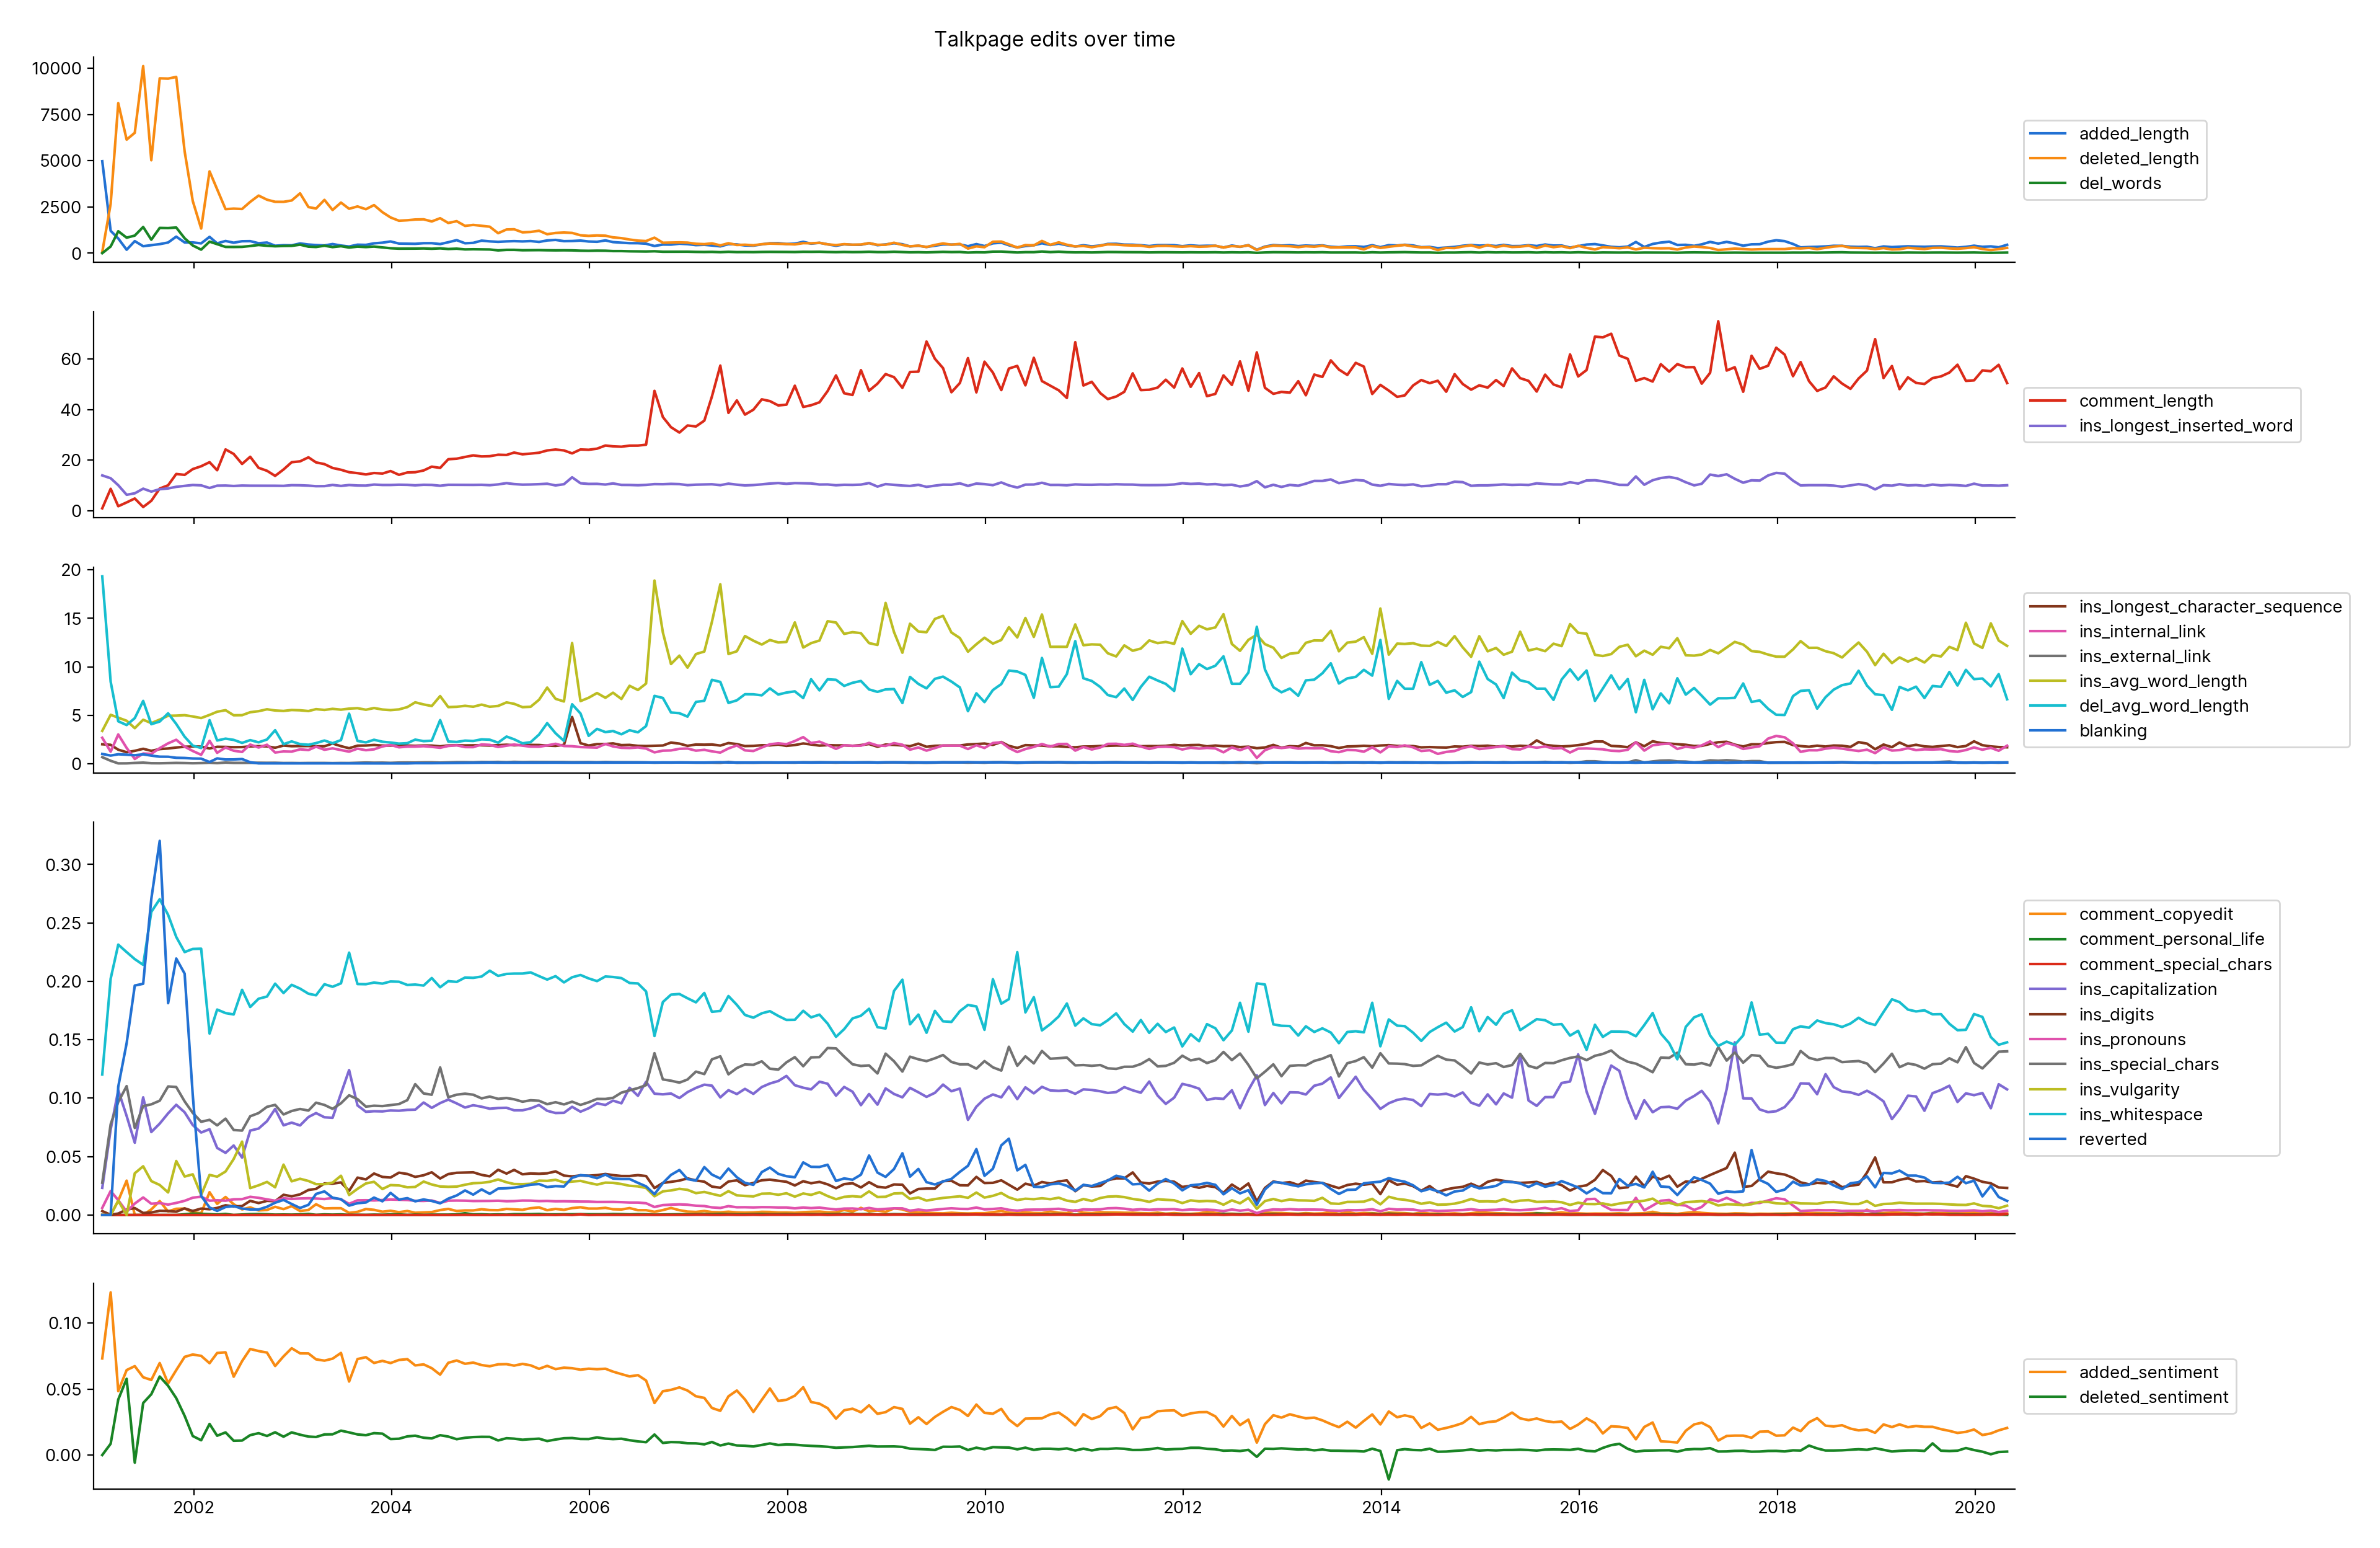
Figure 27.1
All of the features in the previous plots over time.
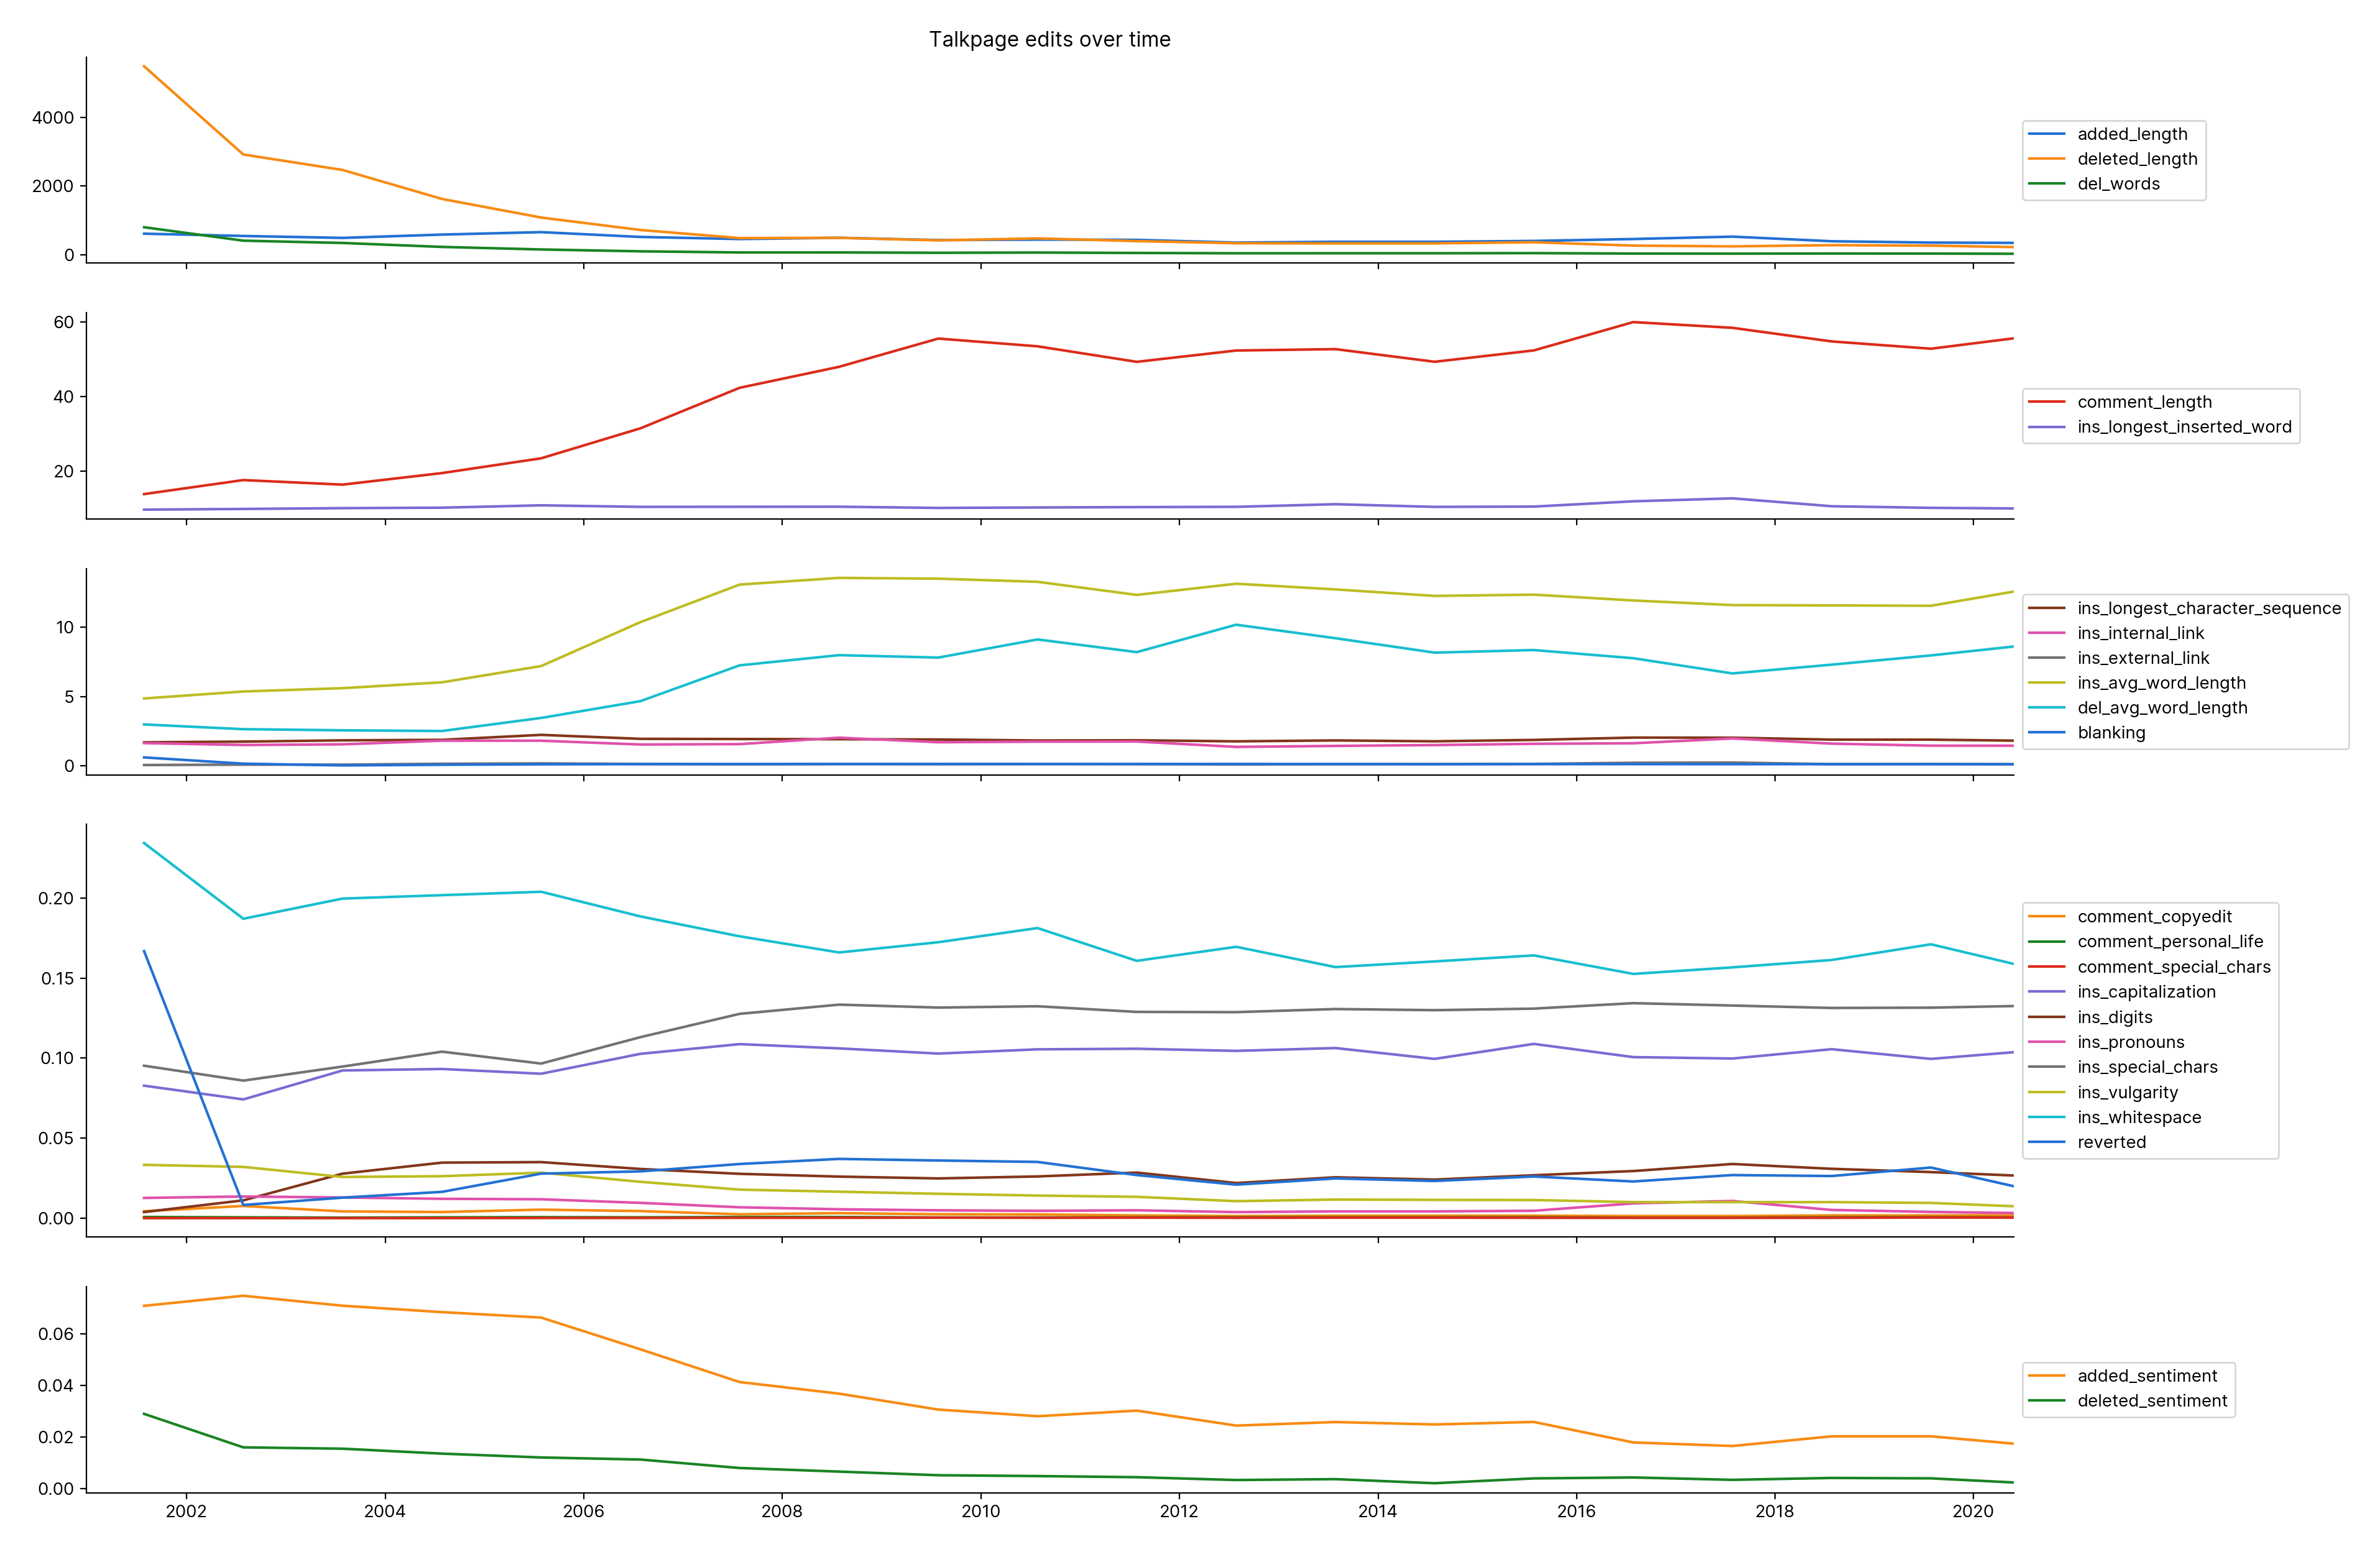
Figure 27.2
Same as the previous plot but averaged per year.
Figure 35.1.1
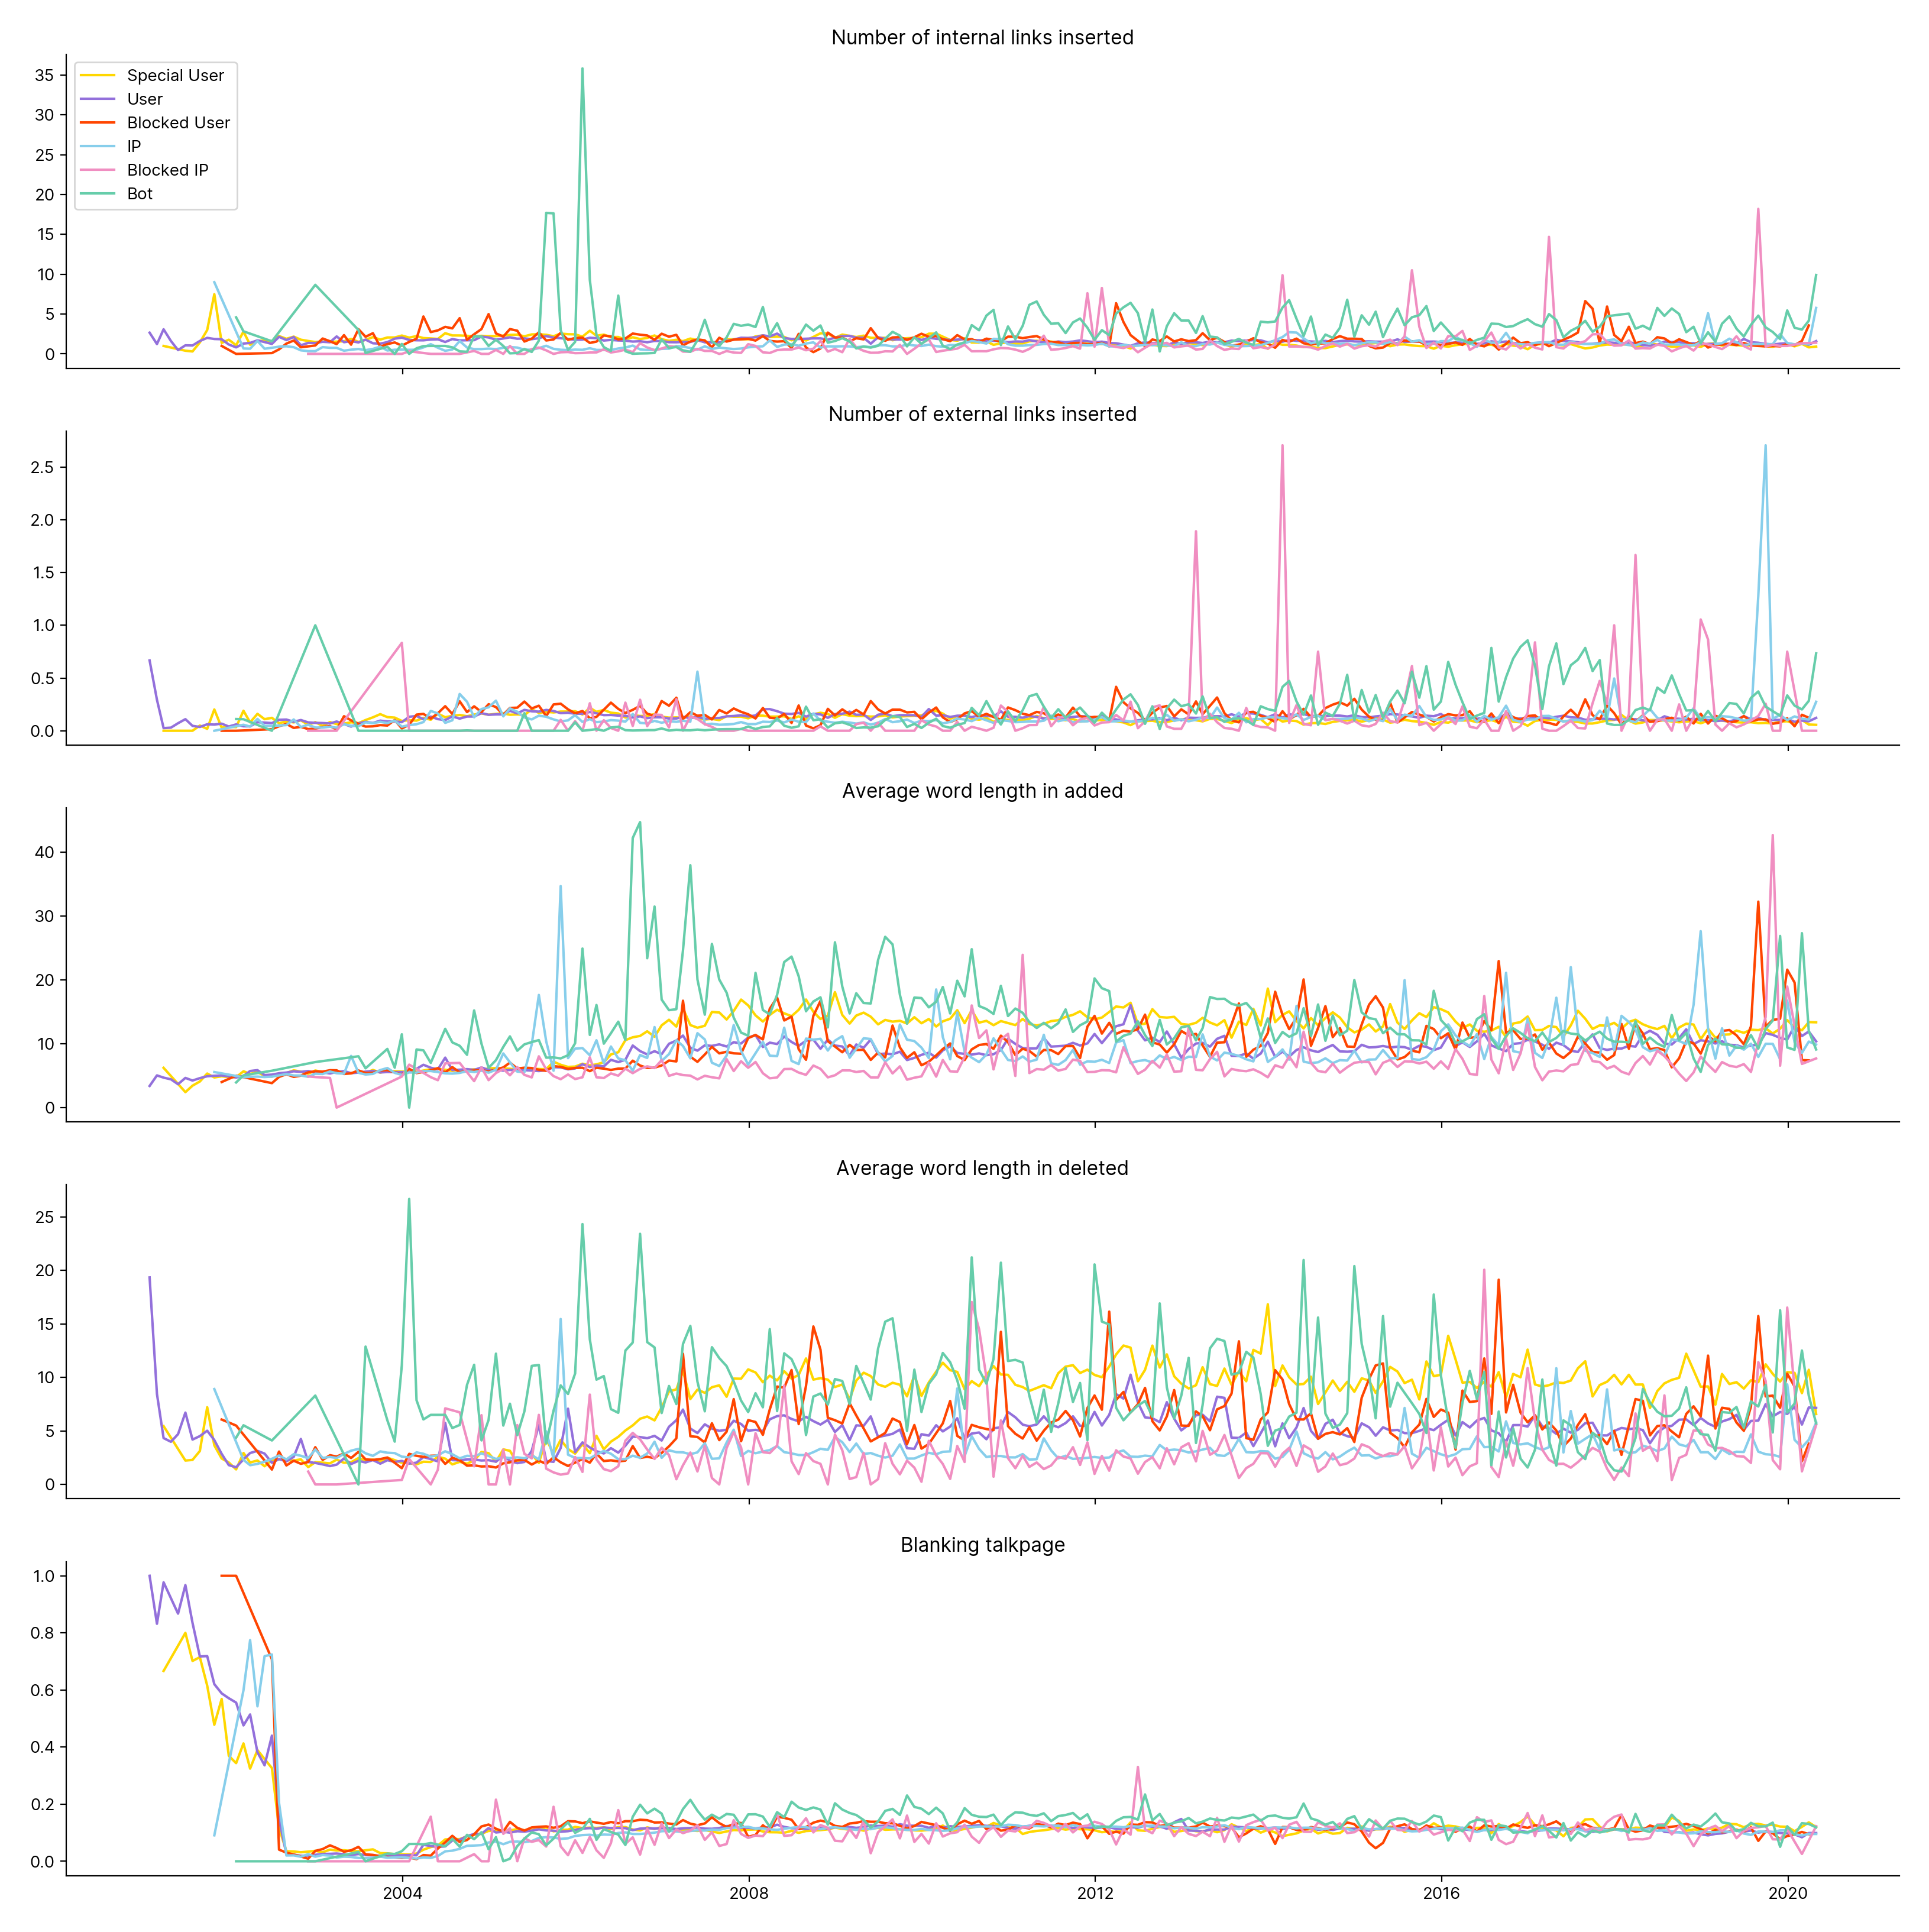
Figure 35.1.2
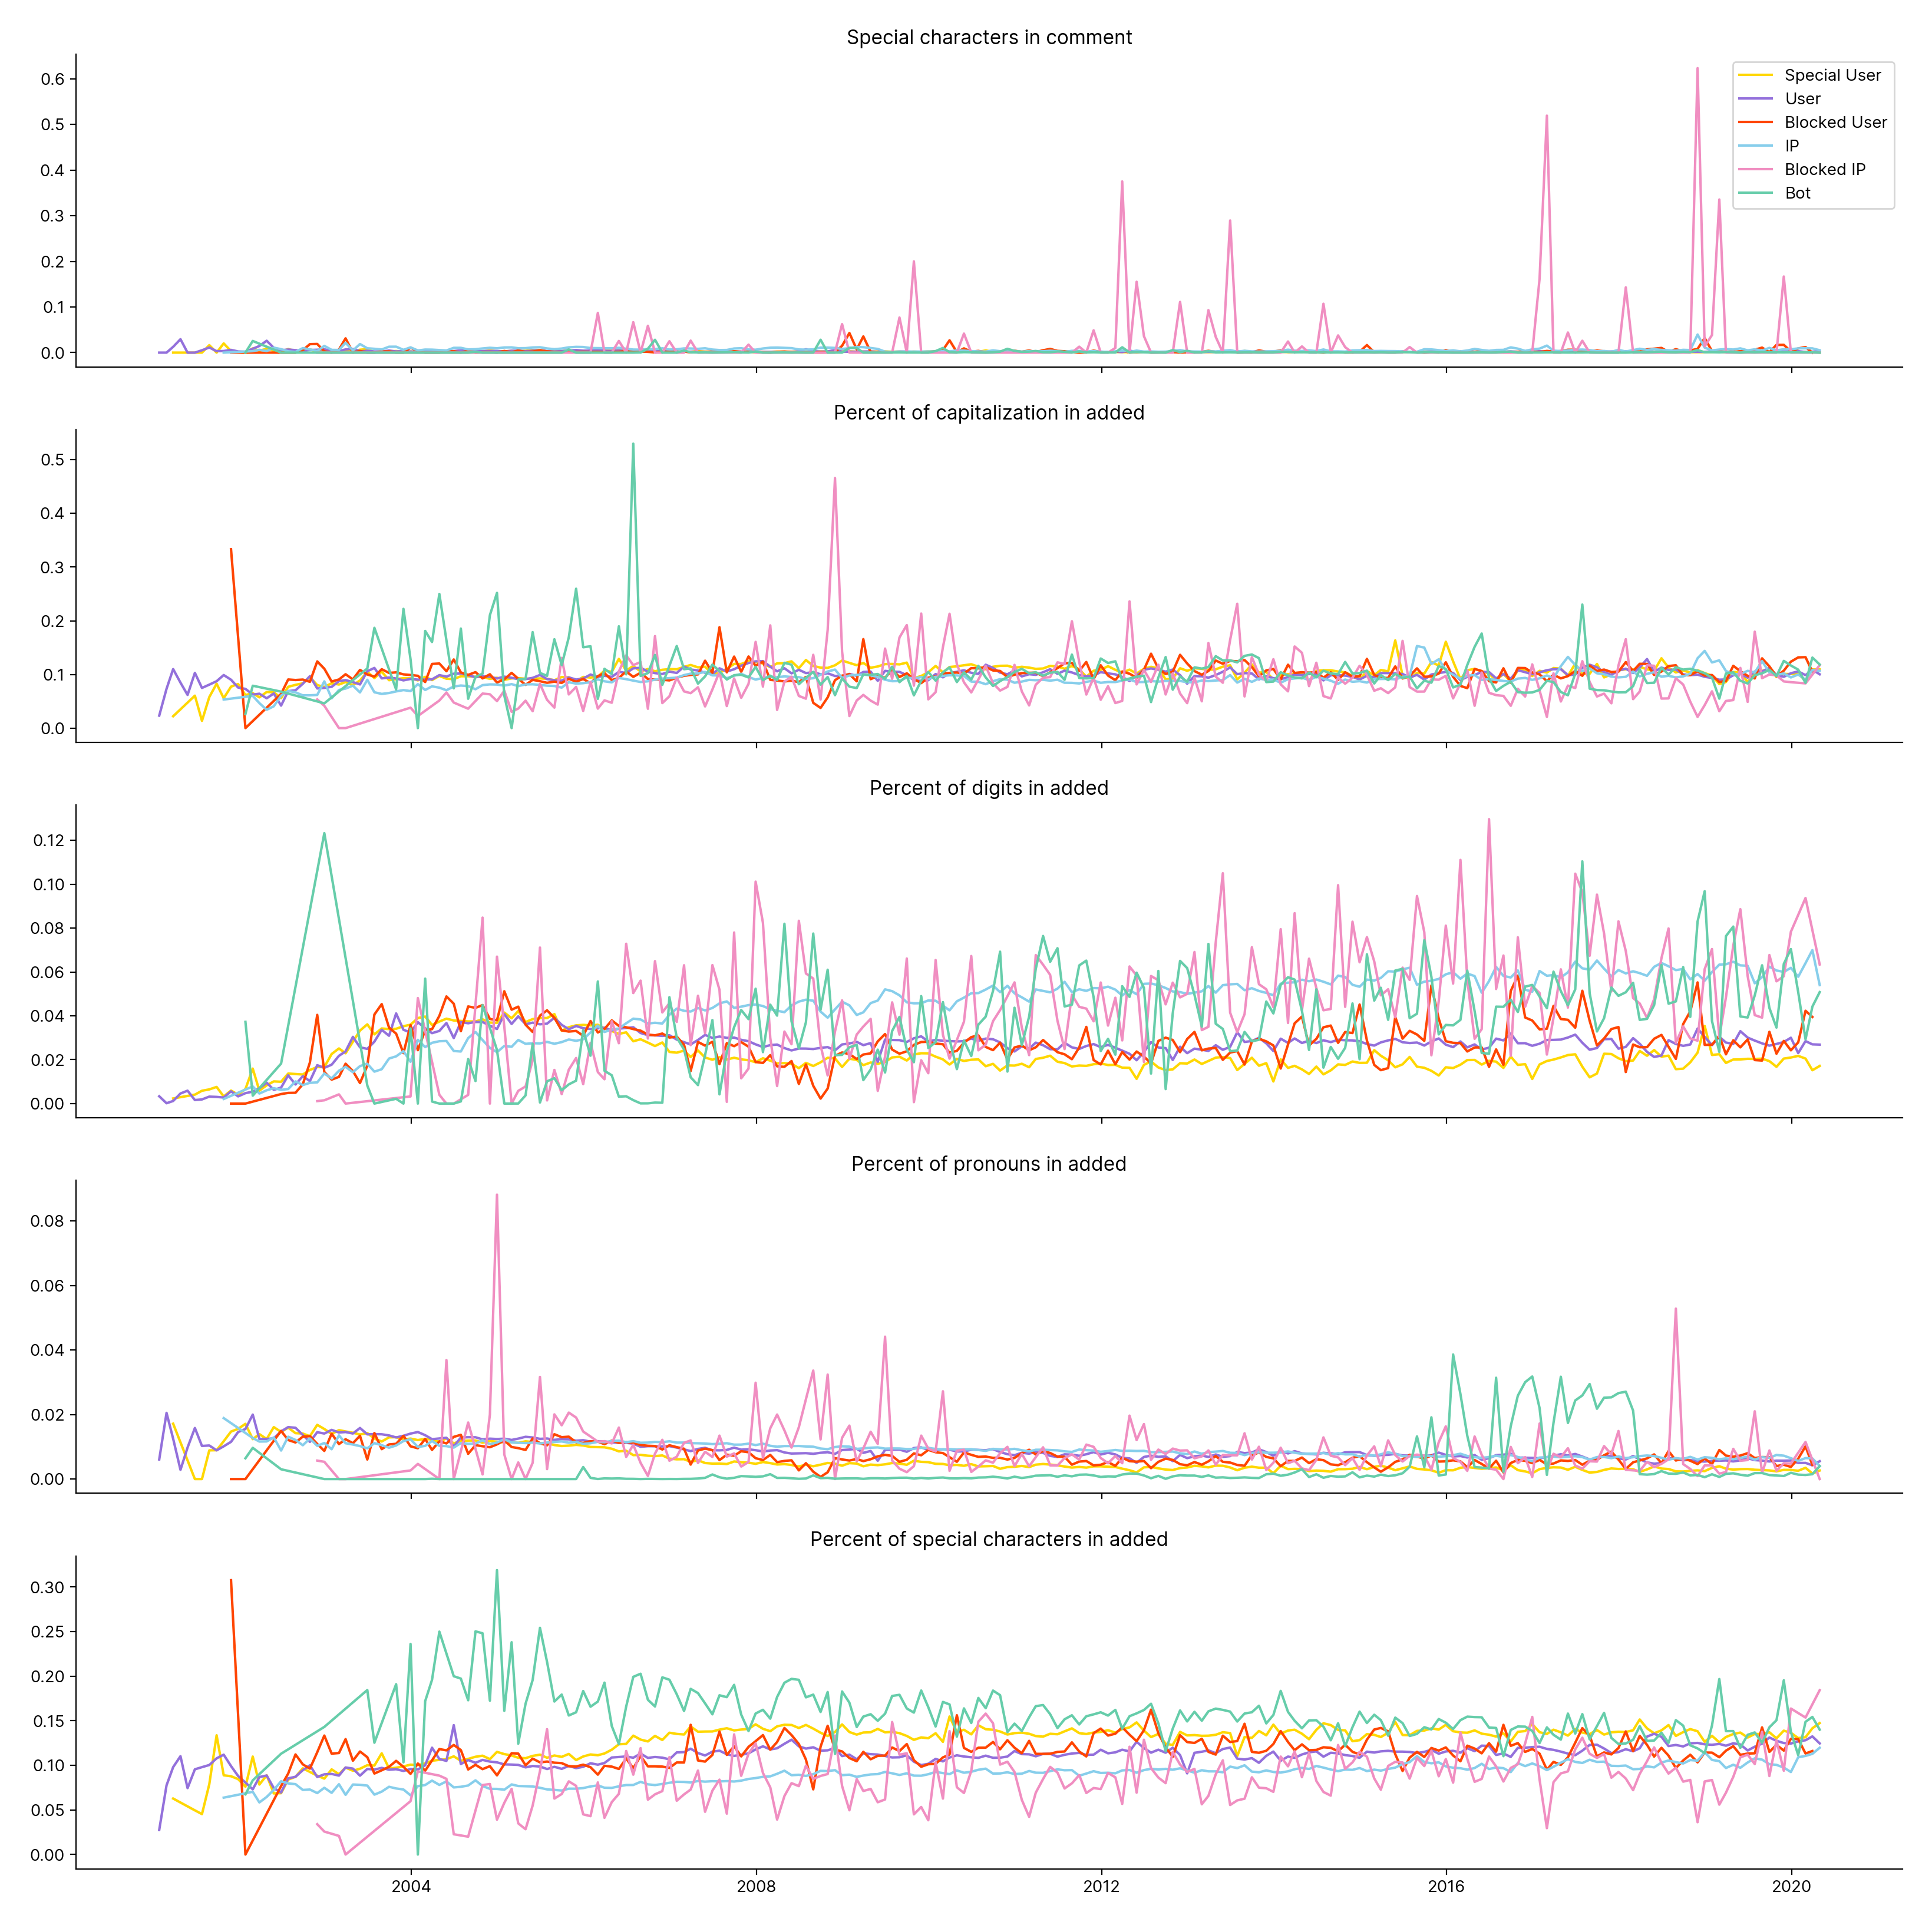
Figure 35.1.3
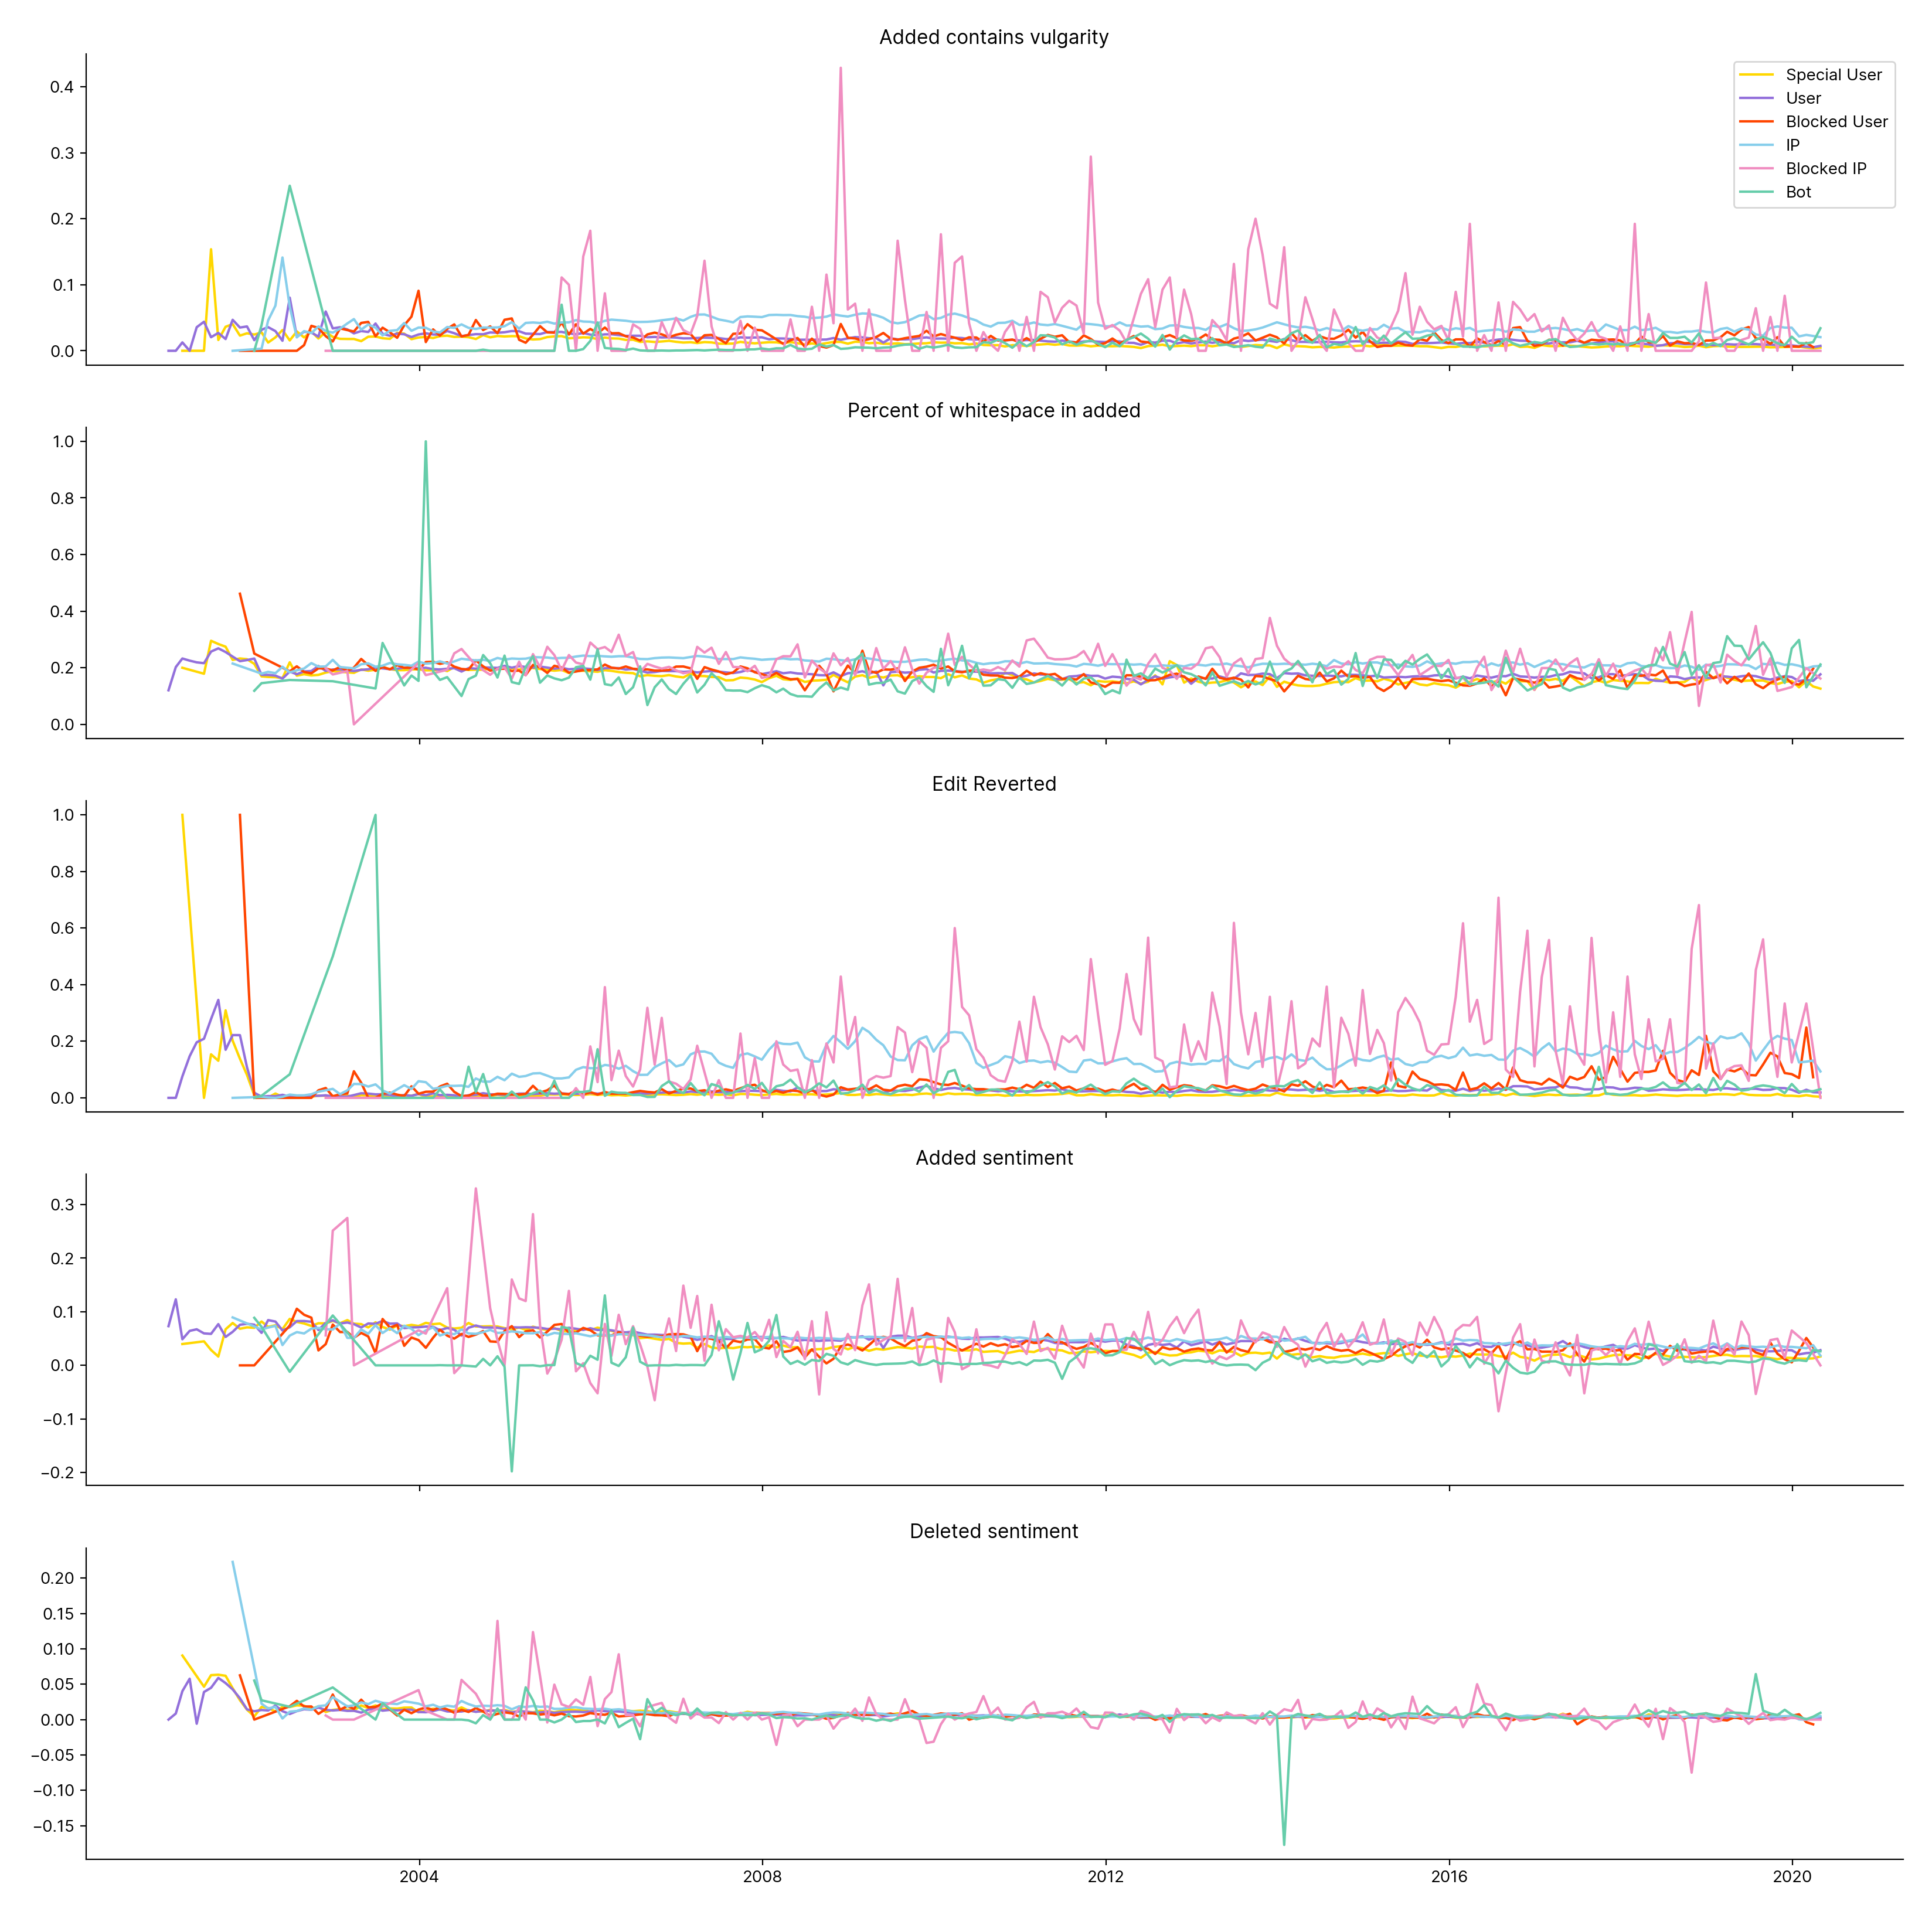
Figure 35.1.4
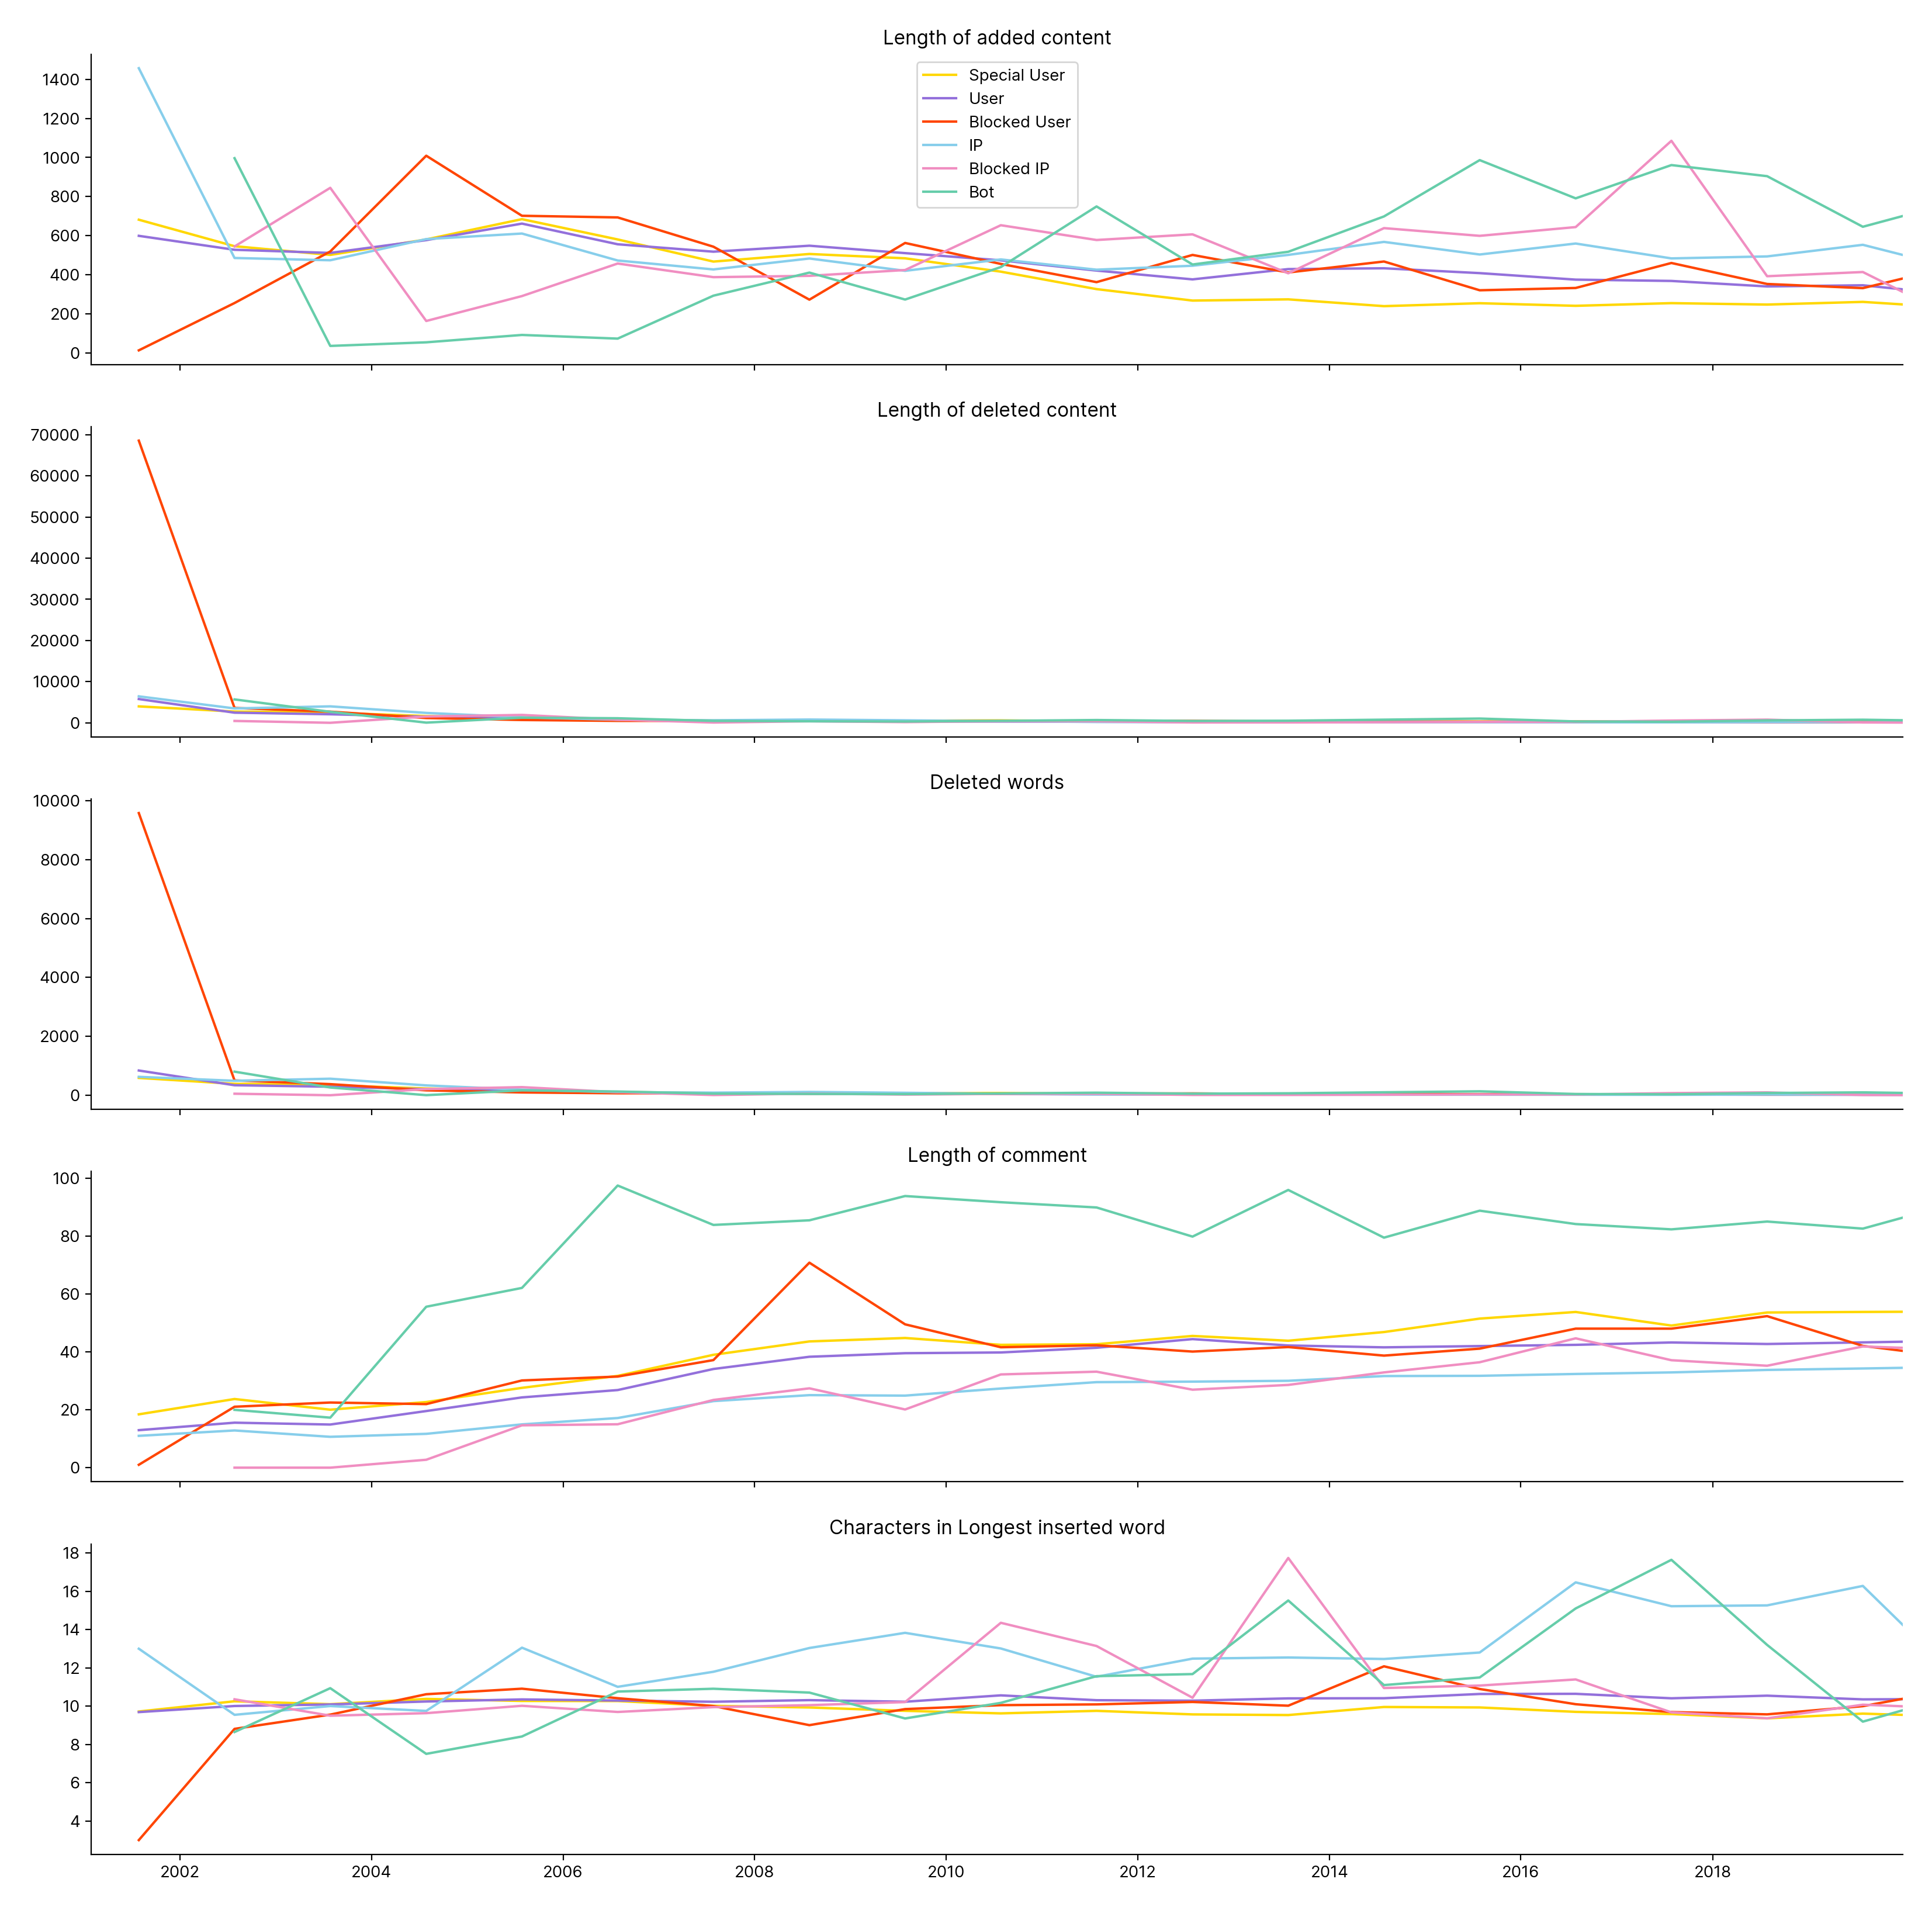
Figure 35.2.1
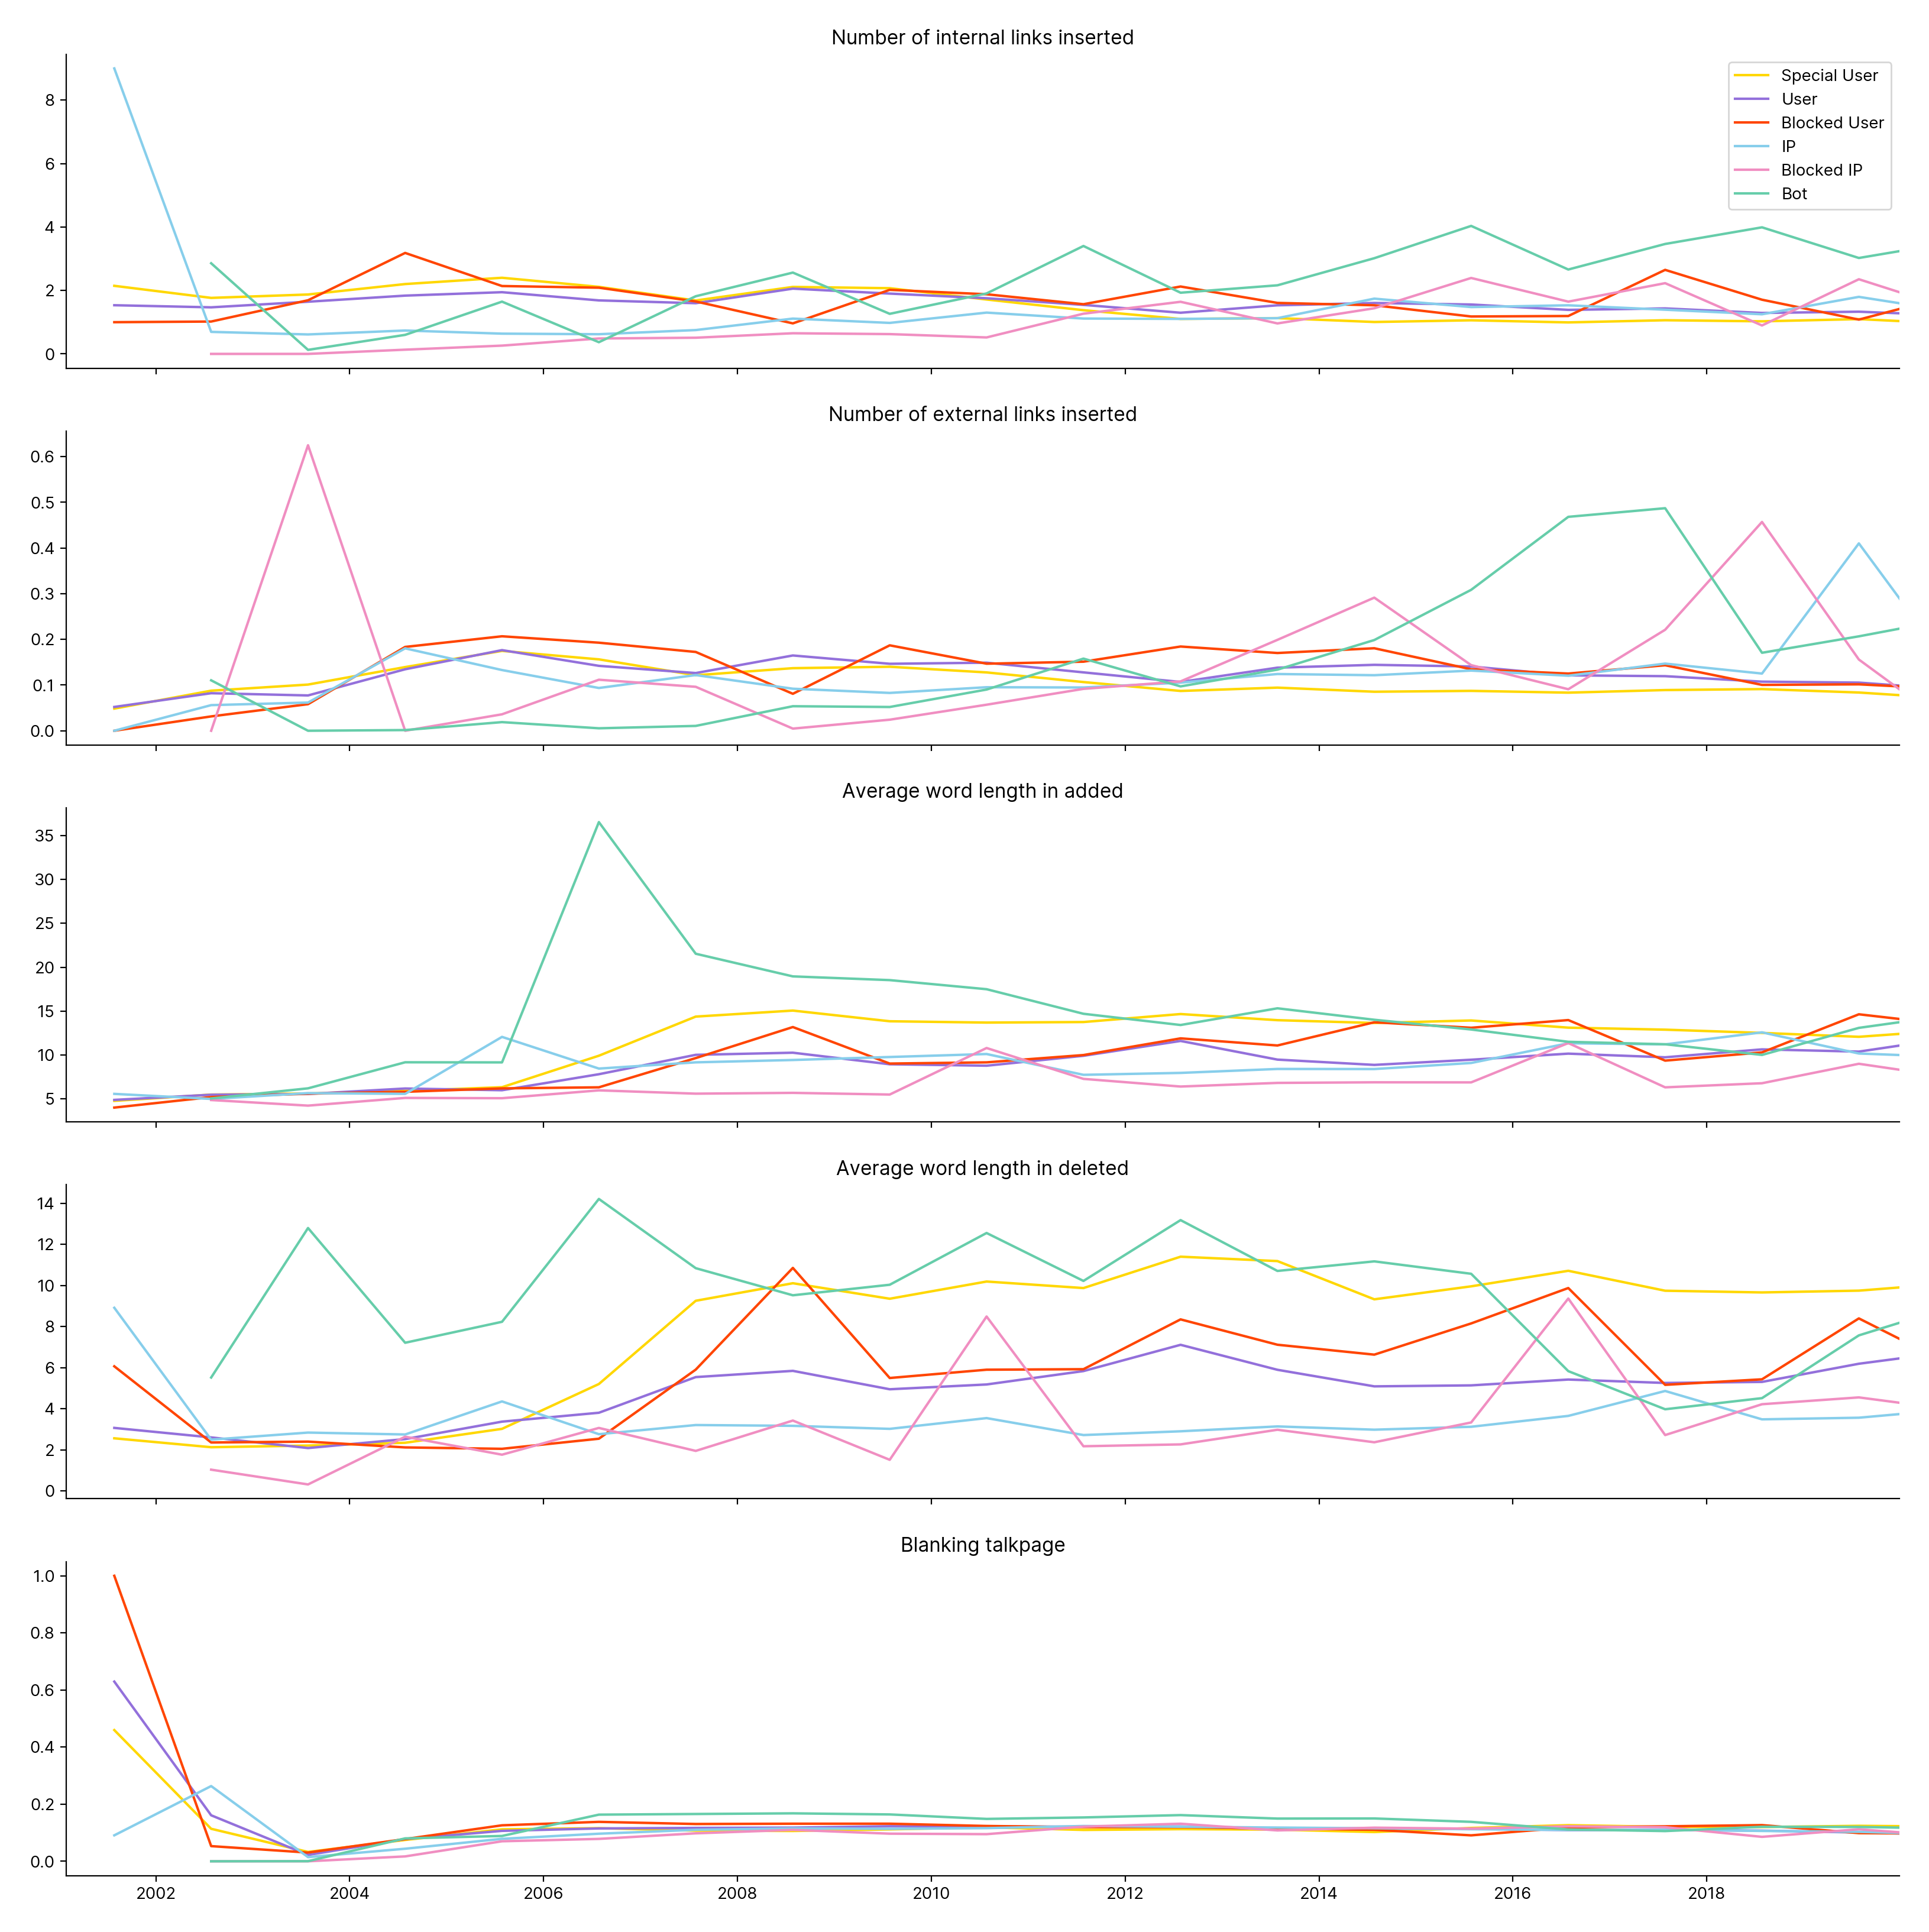
Figure 35.2.2
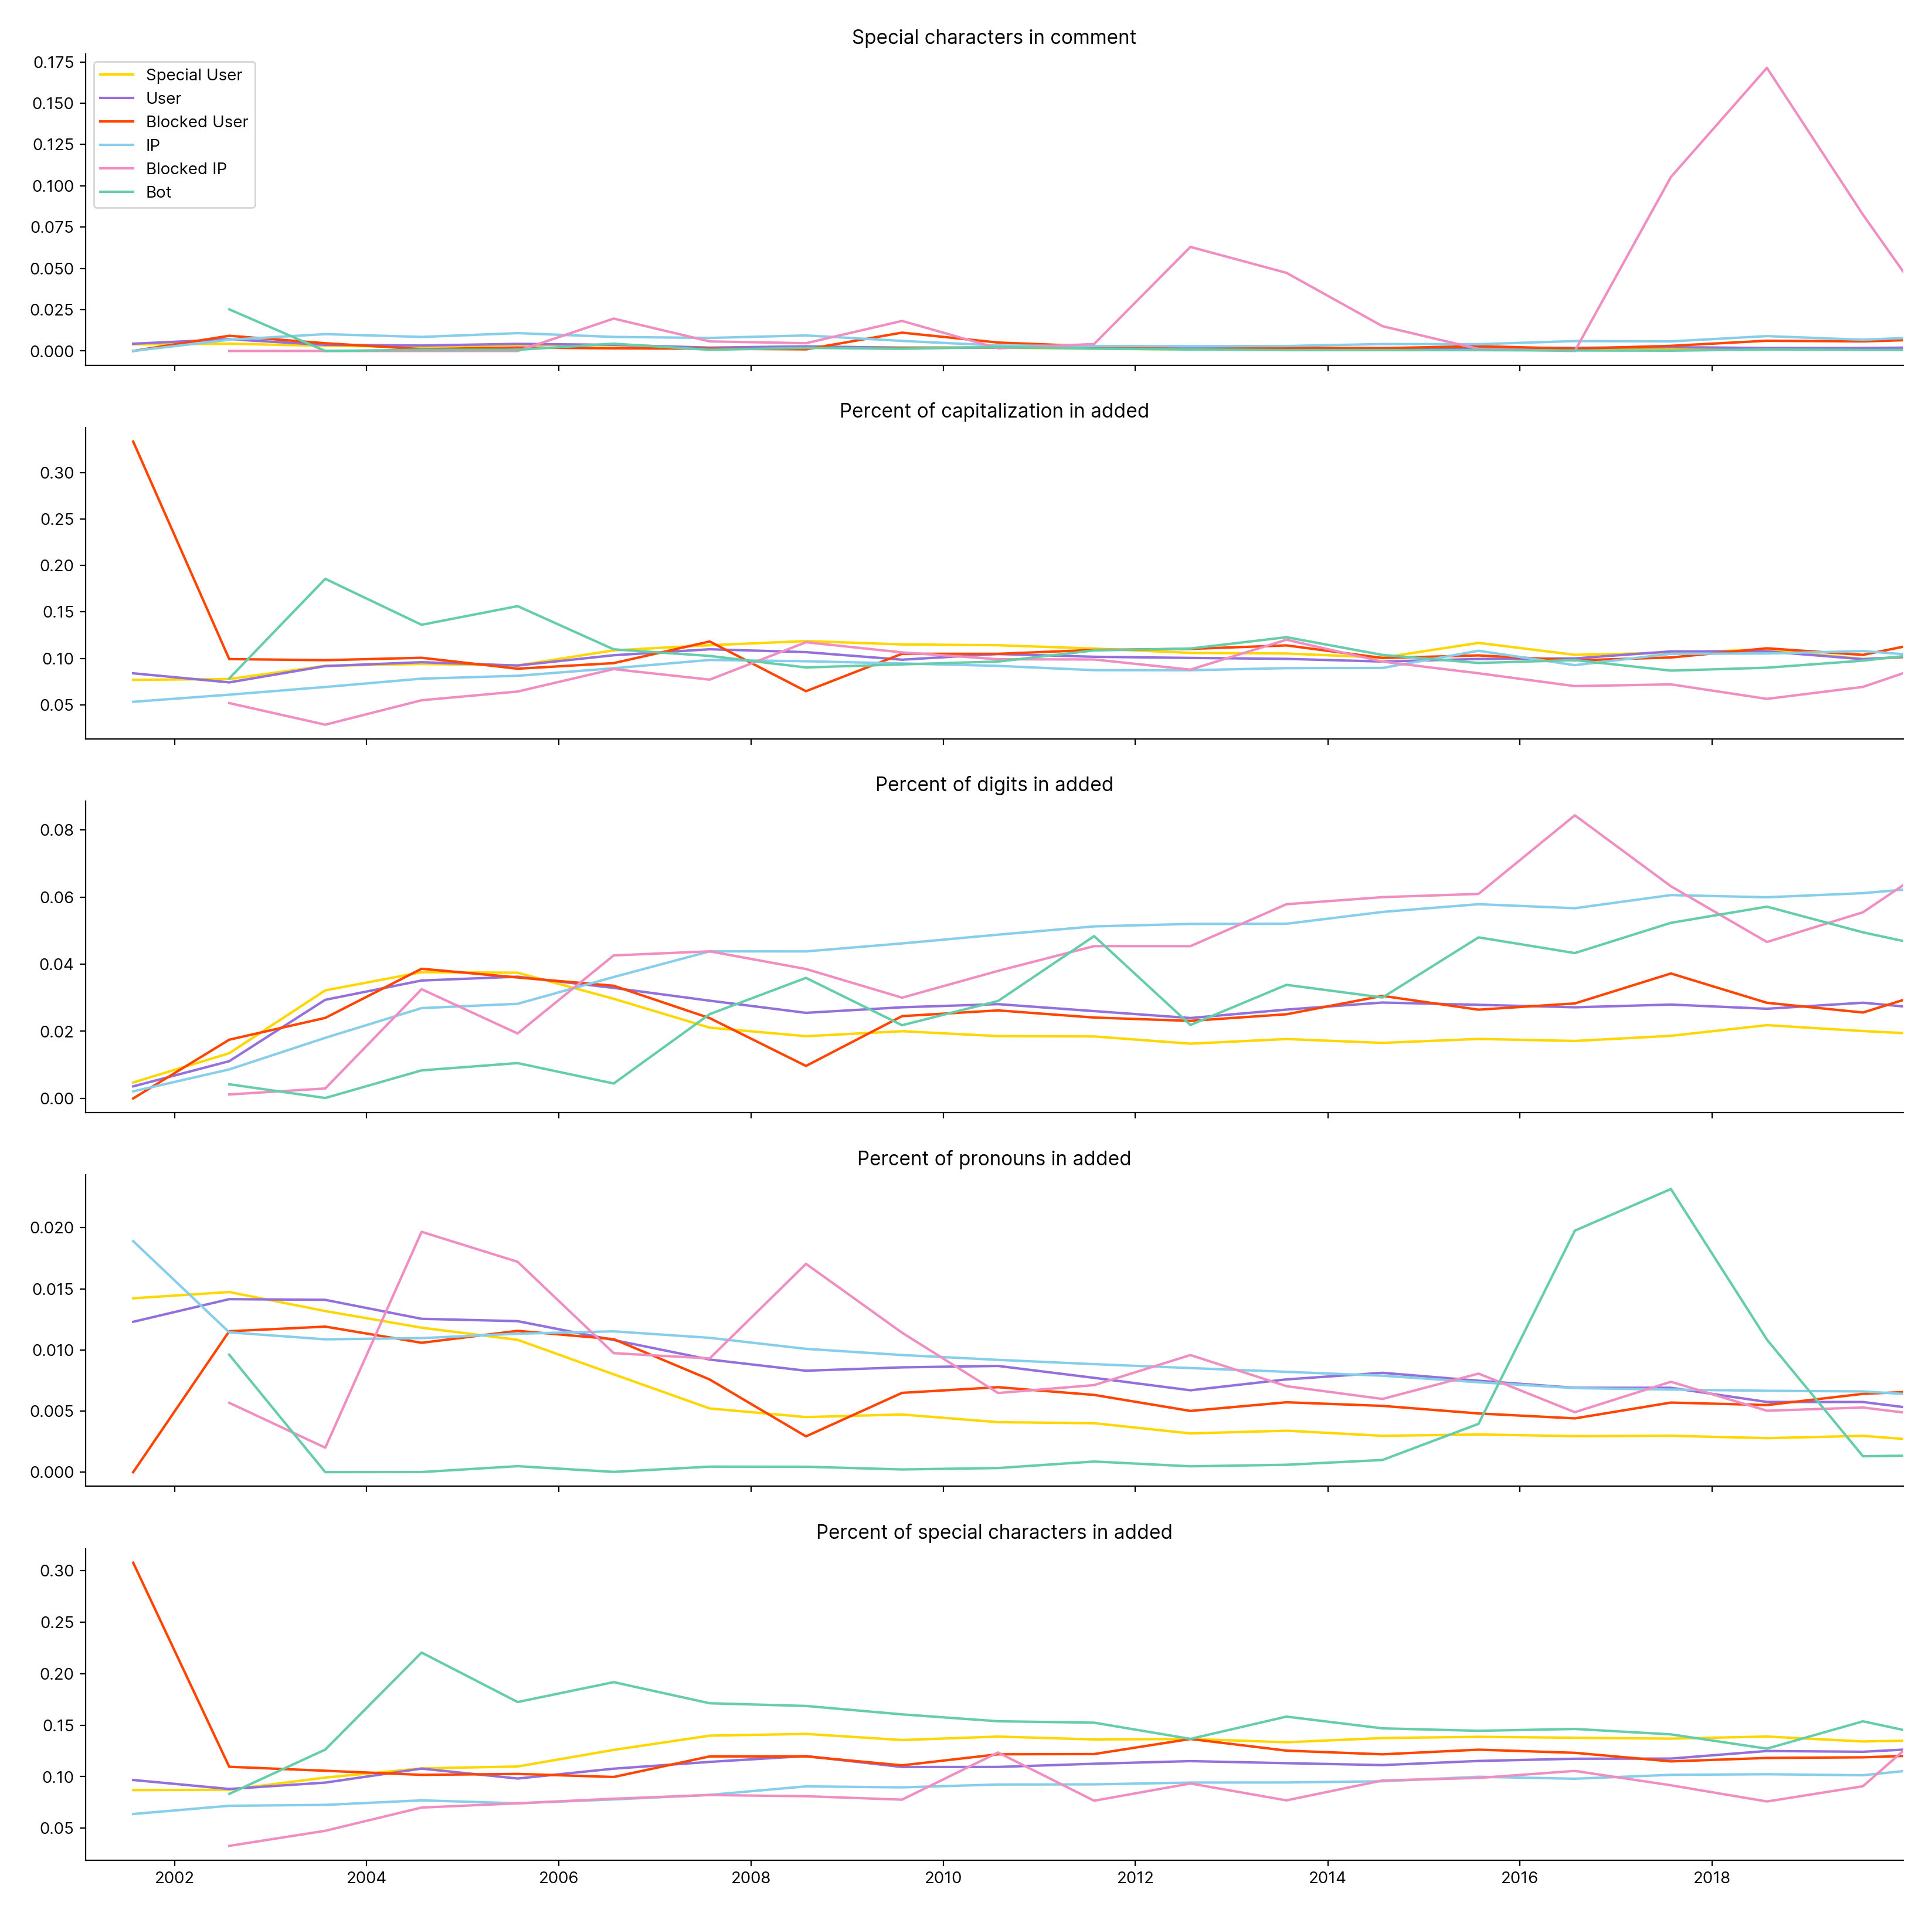
Figure 35.2.3
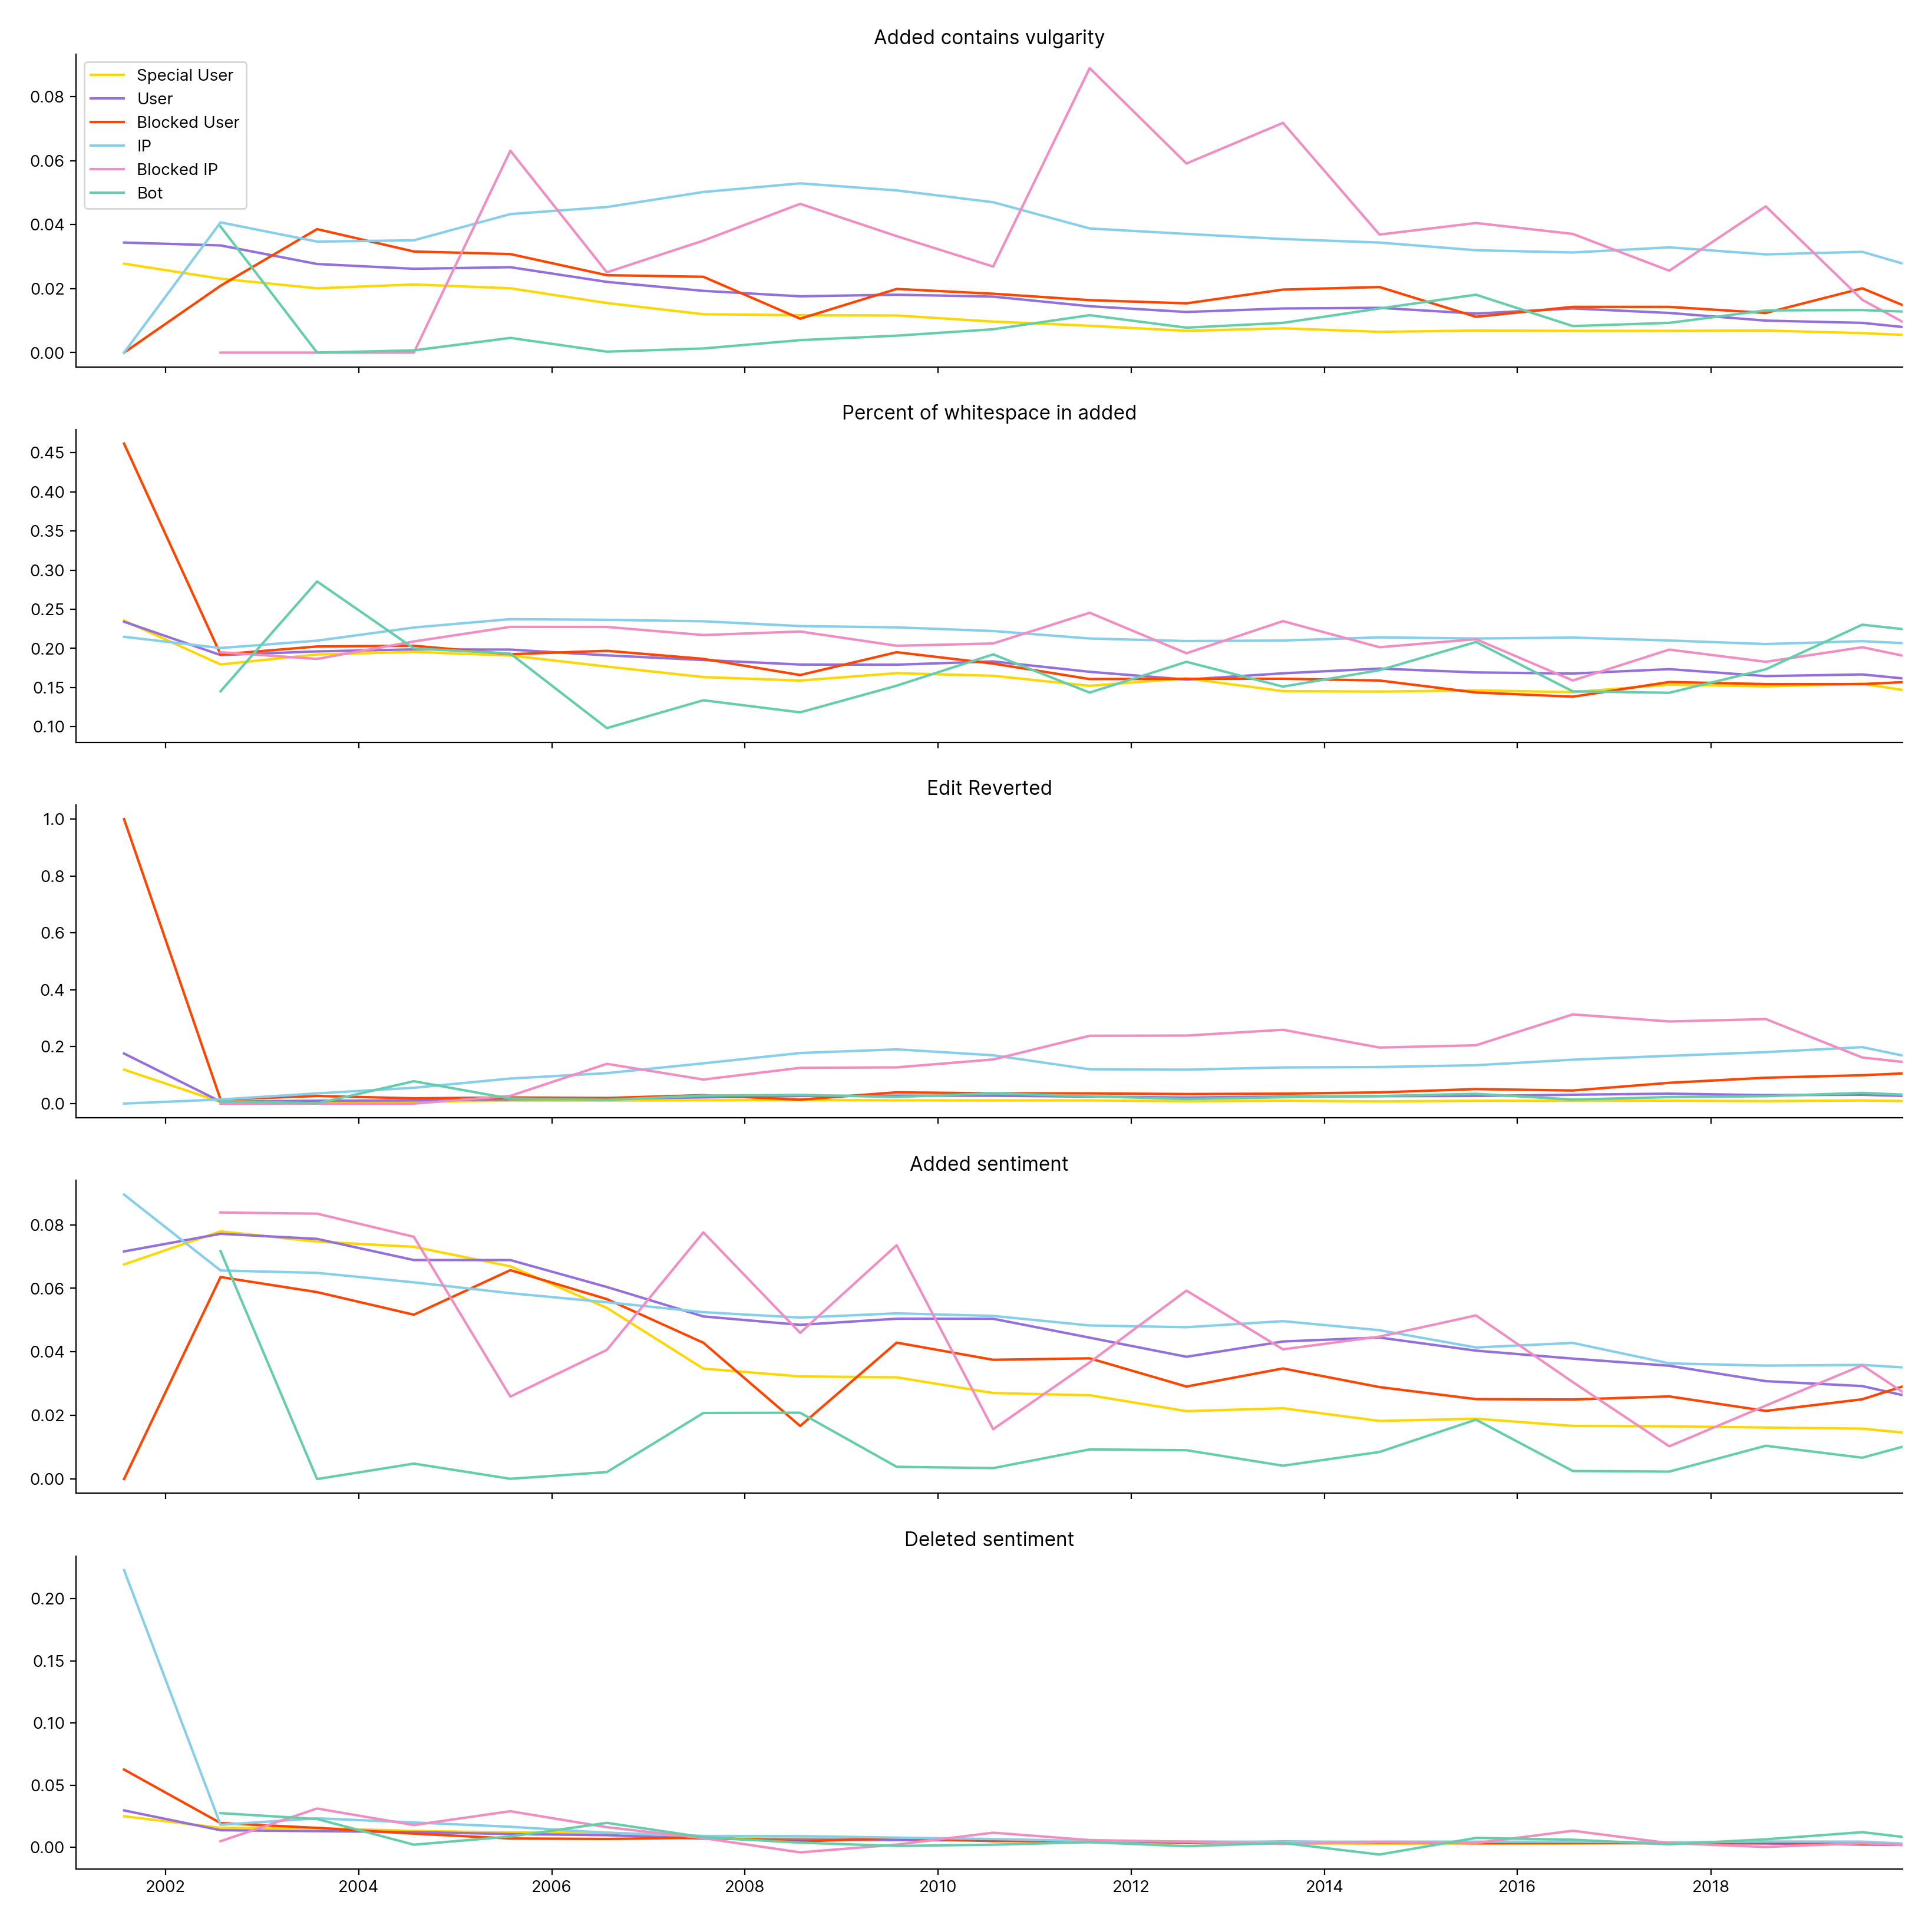
Figure 35.2.4

